Climate in Valeria del Mar (Buenos Aires Province, Argentina)

The graphs below show the monthly weather averages over the year.

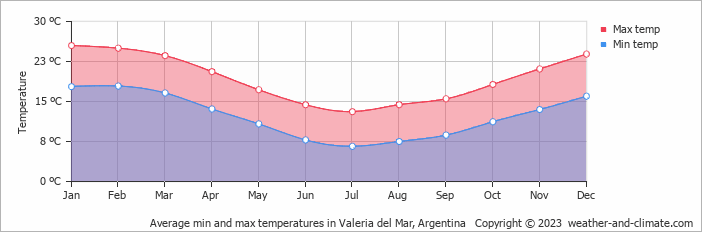
Average day and night temperature

The mean minimum and maximum temperatures over the year. Show in Celsius

Average min and max temperatures in Valeria del Mar, Argentina   Copyright © 2023  weather-and-climate.com

Feel free to add this climate graph to your website. Click the copy button above.

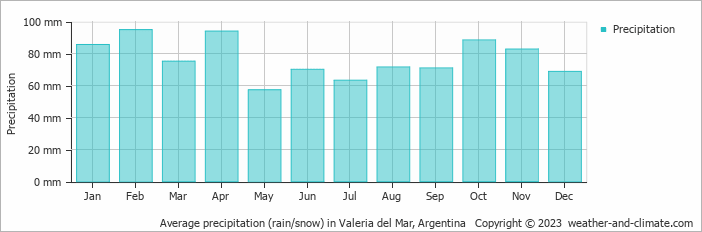
Monthly precipitation

The mean monthly precipitation over the year, including rain, snow, hail etc.
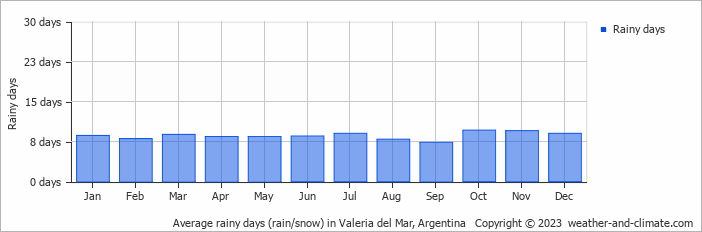
 Show in Millimeter

Average precipitation (rain/snow) in Valeria del Mar, Argentina   Copyright © 2023  weather-and-climate.com

Feel free to add this climate graph to your website. Click the copy button above.

Monthly rainy days

The average number of days each month with rain, snow, hail etc.

Average rainy days (rain/snow) in Valeria del Mar, Argentina   Copyright © 2023  weather-and-climate.com

Feel free to add this climate graph to your website. Click the copy button above.

Average humidity

The mean monthly relative humidity over the year

Average relative humidity in Pinamar, Argentina   Copyright © 2023  weather-and-climate.com

Feel free to add this climate graph to your website. Click the copy button above.

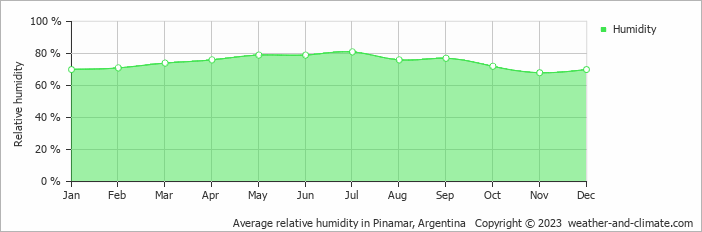
* Data from: Pinamar, Argentina (3 KM, 2 Miles).

Weather Forecasts for Valeria del Mar (Buenos Aires Province)

Sun   Dec 10
77°F | 57°F
E 11 mph
0.1 inches
partly cloudy and  chance of slight rain

partly cloudy and chance of slight rain

Mon   Dec 11
77°F | 59°F
NE 18 mph
broken clouds and no rain

broken clouds and no rain

Tue   Dec 12
82°F | 63°F
N 16 mph
0 inches
partly cloudy and small chance of slight rain

partly cloudy and small chance of slight rain

The best time of year to visit Valeria del Mar in Argentina

During the months of January, February, March, April, November and December you are most likely to experience good weather with pleasant average temperatures that fall between 20 degrees Celsius (68°F) and 26 degrees Celsius (79°F).

Other facts from our historical weather data:

  • Which is the warmest month in Valeria del Mar?
    January has an average maximum temperature of 26°C (78°F) and is the warmest month of the year.
  • Which is the coldest month in Valeria del Mar?
    The coldest month is July with an average maximum temperature of 13°C (56°F).
  • Which is the wettest month in Valeria del Mar?
    February tops the wettest month list with 95mm (3.7in) of rainfall.
  • Which is the driest month in Valeria del Mar?
    May is the driest month with 57mm (2.3in) of precipitation.

  • No idea where to travel to this year? We have a tool that recommends destinations based on your ideal conditions. Find out where to go with our weather planner.