Córdoba, Argentina - Weather and Climate
The climate in Córdoba, Córdoba Province, Argentina is marked by big temperature swings throughout the year.
Temperatures range from very warm during the warmest months
to mild in the cooler months.
It maintains moderate precipitation patterns.
Let’s explore the climate details to provide you with a complete overview.
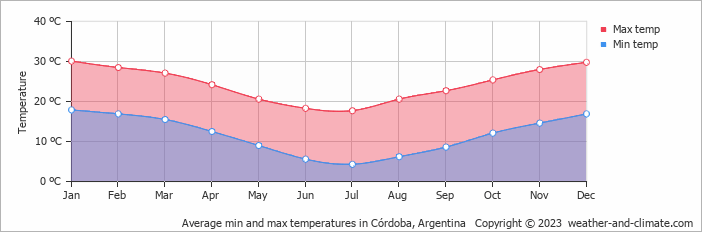
Average maximum day and minimum night temperature
In Córdoba, temperatures differ significantly between summer and winter months. Typically, average maximum daytime temperatures range from a very warm 30°C in January to a moderate 18°C in the coolest month, July.
Nights are cooler, with lows often dropping to around 4°C during the colder months.Check out our detailed temperature page for more information.
Temperature ranges by month
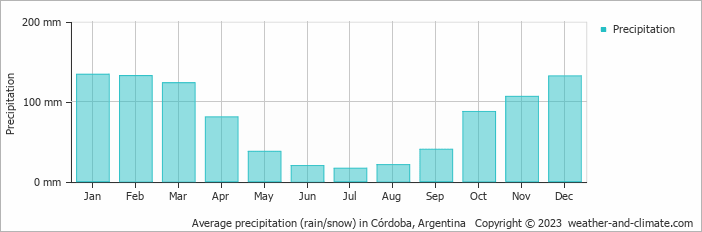
Precipitation and rainy days
On average, Córdoba receives a reasonable amount of rainfall, with an annual precipitation of 930 mm. The climate in Córdoba shows significant variation throughout the year. Expect high rainfall in January, with an average of 134 mm of precipitation over 11 rainy days.
In contrast, July offers drier and sunnier days, with around 16 mm of rainfall over 3 rainy days. For more details, please visit our Córdoba Precipitation page.The mean monthly precipitation over the year, including rain, hail and snow
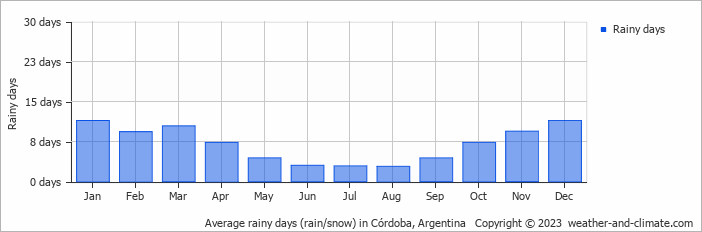
The average number of days each month with precipitation
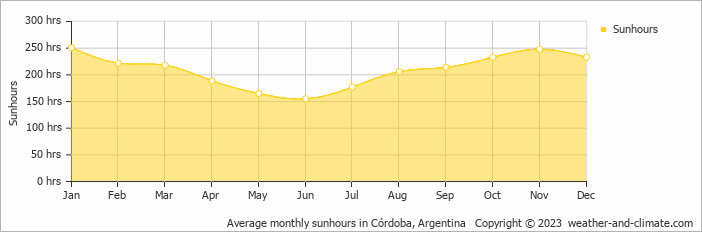
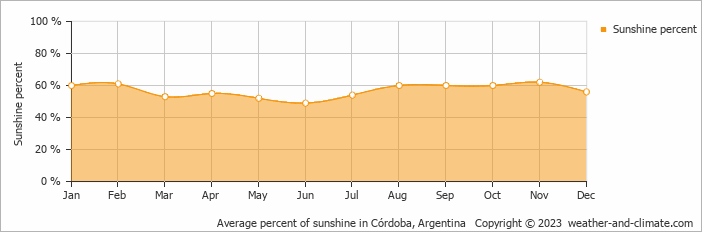
Sunshine over the year
Córdoba offers a pleasant mix of sunny and slightly overcast days. The difference in sunshine hours between January (8.4 hours daily) and June (5.2 hours daily) provides a bit of variety for visitors and residents.
Visit our detailed sunshine hours page for more information.
Monthly hours of sunshine
Daily hours of sunshine
Daily percentage of sunshine
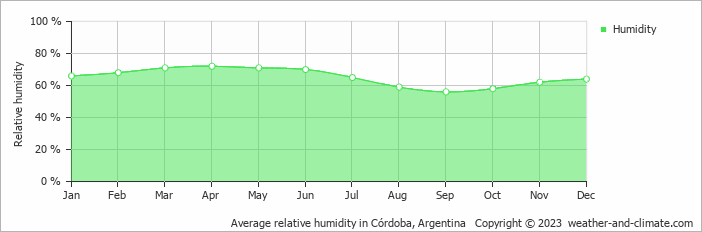
Average humidity
The relative humidity is high throughout the year in Córdoba.
The city experiences its highest humidity in April, reaching 72%. In September, the humidity drops to its lowest level at 56%. What does this mean? Read our detailed page on humidity levels for further details.
Relative humidity over the year
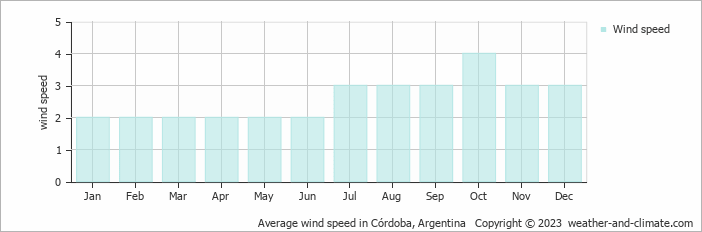
Average wind speed
The mean wind speed over the year ranges from 2 m/s in January, February, March, April, May and June to 4 m/s in October.
The mean monthly wind speed over the year (meters per second)
Forecast for Córdoba


Select a Month of Interest
Check the conditions for any month of the year.
The best time of year to visit Córdoba in Argentina
During the months of April, May, August, September and October you are most likely to experience good weather with pleasant average temperatures that fall between 20°C and 26°C.Other facts from our historical weather data:
Yes, the months of June and July are very dry.
January has an average maximum temperature of 30°C and is the warmest month of the year.
The coldest month is July with an average maximum temperature of 18°C.
January tops the wettest month list with 134 mm of rainfall.
July is the driest month with 16 mm of precipitation.
January is the sunniest month with an average of 251 hours of sunshine.
No idea where to travel to this year? We have a tool that recommends destinations based on your ideal conditions. Find out where to go with our weather planner.


