Sunshine Coast Climate by Month
The temperature in Sunshine Coast varies moderately throughout the year.
The temperatures shift from very warm
to warm.
It receives mid-range precipitation levels.
Let’s explore the climate details in depth to provide you with a complete overview.
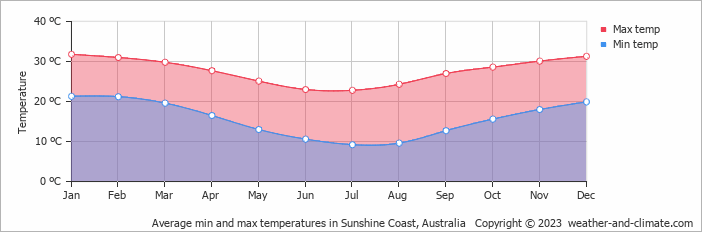
Average day and night temperature
The climate in Sunshine Coast experiences moderate temperature changes, with mild shifts between seasons. Average daytime temperatures range from a very warm 32°C in January, the warmest time of the year, to a comfortable 23°C during cooler months like July. At night, temperatures typically average around 9°C during these months.
The mean minimum and maximum temperatures throughout the year
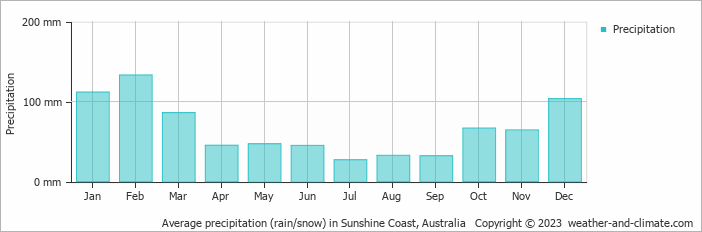
Precipitation and rainy days
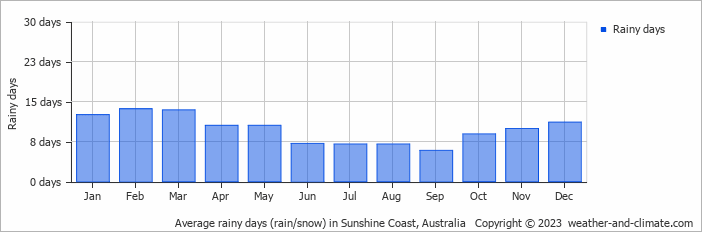
Generally, Sunshine Coast has a moderate amount of precipitation, averaging 793 mm of rainfall annually. Significant seasonal changes in precipitation occur throughout the year. During the wetter season, February receives high rainfall, averaging 133 mm of precipitation, recorded across 14 rainy days. In contrast, the drier season, July brings less rainfall, with 27 mm over 7 rainy days.The mean monthly precipitation over the year, including rain, hail and snow
The average number of days each month with precipitation
Sunshine over the year
While the amount of sunshine in Sunshine Coast varies throughout the year, all seasons offer their own charm. Enjoy up to 8.5 hours of daily sun in October, and experience slightly darker atmosphere in June, with about 6.3 hours of daily sunlight.Monthly hours of sunshine
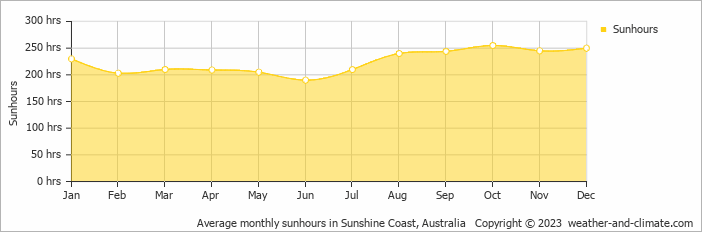
Daily hours of sunshine
Average humidity
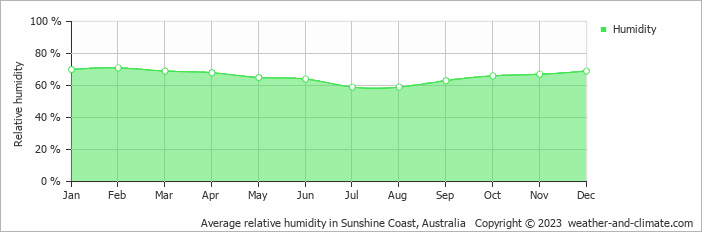
The relative humidity is low throughout the year in Sunshine Coast.
Relative humidity over the year
The best time of year to visit Sunshine Coast in Australia
During the months of May, June, July and August you are most likely to experience good weather with pleasant average temperatures that fall between 20°C and 26°C.Other facts from our historical weather data:
January has an average maximum temperature of 32°C and is the warmest month of the year.
The coldest month is July with an average maximum temperature of 23°C.
February tops the wettest month list with 133 mm of rainfall.
July is the driest month with 27 mm of precipitation.
October is the sunniest month with an average of 255 hours of sunshine.
No idea where to travel to this year? We have a tool that recommends destinations based on your ideal conditions. Find out where to go with our weather planner.


