Vilcabamba Weather & Climate: Best Time to Visit
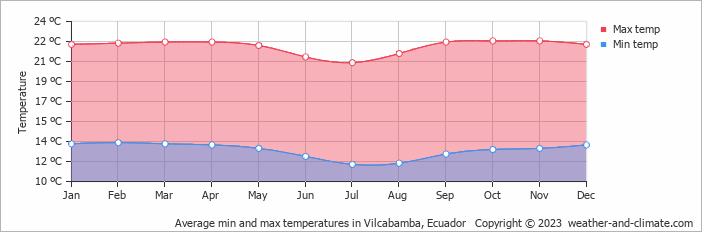
Vilcabamba, Chimborazo Province, Ecuador, has a stable climate with little temperature variation across the year. Average daytime temperatures hover around 22°C (72°F), peaking in October at 22°C (72°F) and dipping in July to 20°C (68°F).
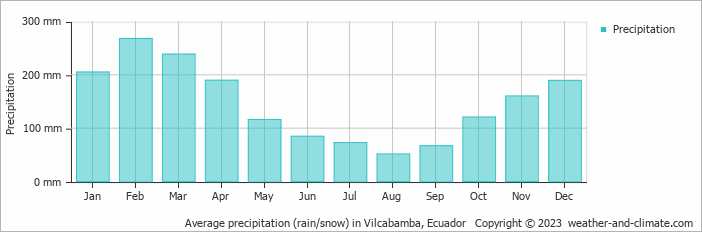
With around 1763 mm (69 in) of annual rainfall, Vilcabamba has a notably wet climate. However, this rainfall is not evenly distributed — the city has a distinct rainy season from December to April. The wettest month is February.
Monthly Temperature in Vilcabamba
With minimal seasonal shifts, Vilcabamba experiences a constant climate year-round. Average daytime temperatures reach a comfortable 22°C (72°F) in October. In July, the coolest month of the year, temperatures drop to a pleasant 20°C (68°F).
At night, temperatures range from around 13°C (55°F) in October to 12°C (54°F) in July.
Check out our detailed temperature page for more information.
Temperature ranges by month
Rainfall in Vilcabamba
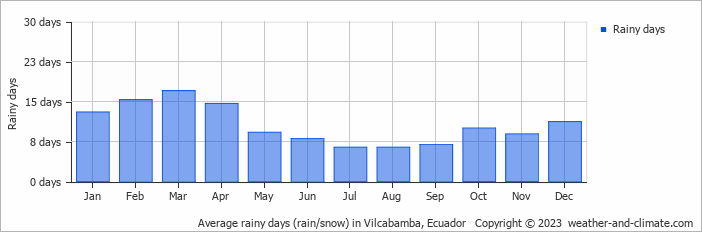
Vilcabamba has a notably wet climate with abundant precipitation, recording 1763 mm (69 in) of rainfall per year. Vilcabamba can be quite wet during February, receiving approximately 268 mm (11 in) of precipitation over 15 rainy days.
In contrast, during the driest month (August), you will experience much drier conditions, with 52 mm (2 in) of precipitation spread across 6 rainy days days. For more details, please visit our Vilcabamba Precipitation page.
The mean monthly precipitation over the year, including rain, hail, and snow
The average number of days each month with precipitation
Vilcabamba 3-Day Forecast
Check the conditions for any month of the year.
Best Time to Visit Vilcabamba
Vilcabamba's weather is most enjoyable during May, June, July, August, September and October, with comfortable temperatures from 20°C (69°F) to 22°C (72°F). The moderate conditions ensure pleasant weather for exploring the area. Expect varied weather during this period with rainfall between 52 mm (2 in) and 121 mm (4.8 in), providing a good balance of sunny and rainy days.The wettest months are January, February, March, April, November and December, when precipitation is at its highest. Planning your next adventure but unsure where to go? Our climate tool suggests perfect locations tailored to your preferred weather conditions. Discover your ideal travel destination with our weather planner.


