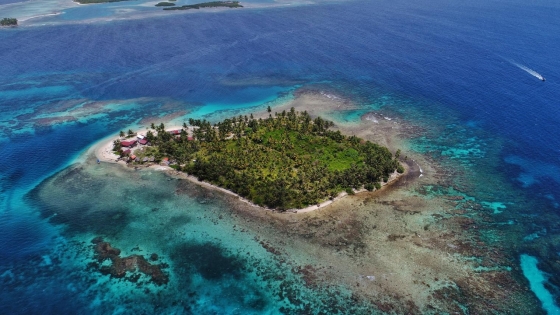
 Discover the San Blas Islands
The San Blas Islands are among the most beautiful islands in the Caribbean and perhaps even in the world. These tropical pearls are located in the north of Panama.
In January the weather in Panama ranges from mixed in Bastimentos to excellent in Panama City. The temperatures range from high in Cerro Punta with 24°C (75°F) to very high in Santiago with 33°C (91°F). These night and day temperatures are an average and some days may be even warmer. So be prepared and bring light clothes.
Find more detailed climate information for Panama in January here.
Perfect weather is subjective. On this map perfect weather has been defined with temperatures between 20°C (68°F) and 29°C (84°F) and not too much precipitation (less than 90 mm (3.5 in) a month).
In February the weather in Panama ranges from good in Punta Laurel to excellent in Panama City. The temperatures range from high in Cerro Punta with 25°C (77°F) to very high in Santiago with 34°C (93°F). These night and day temperatures are an average and some days may be even warmer. So be prepared and bring light clothes.
Find more detailed climate information for Panama in February here.
Perfect weather is subjective. On this map perfect weather has been defined with temperatures between 20°C (68°F) and 29°C (84°F) and not too much precipitation (less than 90 mm (3.5 in) a month).
In March the weather in Panama ranges from very good in Bocas del Toro to excellent in Panama City. The temperatures range from high in Cerro Punta with 25°C (77°F) to very high in Santiago with 35°C (95°F). These night and day temperatures are an average and some days may be even warmer. So be prepared and bring light clothes.
Find more detailed climate information for Panama in March here.
Perfect weather is subjective. On this map perfect weather has been defined with temperatures between 20°C (68°F) and 29°C (84°F) and not too much precipitation (less than 90 mm (3.5 in) a month).
In April the weather in Panama ranges from mixed in Volcán to excellent in Contadora. The temperatures range from high in Cerro Punta with 26°C (79°F) to very high in Santiago with 35°C (95°F). These night and day temperatures are an average and some days may be even warmer. So be prepared and bring light clothes.
Find more detailed climate information for Panama in April here.
Perfect weather is subjective. On this map perfect weather has been defined with temperatures between 20°C (68°F) and 29°C (84°F) and not too much precipitation (less than 90 mm (3.5 in) a month).
In May the weather in Panama ranges from less favorable in Panama City to mixed in Playa Blanca. The temperatures range from high in Cerro Punta with 26°C (79°F) to very high in Chitré with 32°C (90°F). These night and day temperatures are an average and some days may be even warmer. So be prepared and bring light clothes.
Find more detailed climate information for Panama in May here.
Perfect weather is subjective. On this map perfect weather has been defined with temperatures between 20°C (68°F) and 29°C (84°F) and not too much precipitation (less than 90 mm (3.5 in) a month).
In June the weather in Panama is generally less favorable. The temperatures range from high in Paso Ancho with 26°C (79°F) to very high in Chitré with 32°C (90°F). These night and day temperatures are an average and some days may be even warmer. So be prepared and bring light clothes.
Find more detailed climate information for Panama in June here.
Perfect weather is subjective. On this map perfect weather has been defined with temperatures between 20°C (68°F) and 29°C (84°F) and not too much precipitation (less than 90 mm (3.5 in) a month).
In July the weather in Panama is generally less favorable. The temperatures range from high in Cerro Punta with 25°C (77°F) to very high in Santiago with 32°C (90°F). These night and day temperatures are an average and some days may be even warmer. So be prepared and bring light clothes.
Find more detailed climate information for Panama in July here.
Perfect weather is subjective. On this map perfect weather has been defined with temperatures between 20°C (68°F) and 29°C (84°F) and not too much precipitation (less than 90 mm (3.5 in) a month).
In August the weather in Panama is generally less favorable. The temperatures range from high in Cerro Punta with 25°C (77°F) to very high in Chitré with 32°C (90°F). These night and day temperatures are an average and some days may be even warmer. So be prepared and bring light clothes.
Find more detailed climate information for Panama in August here.
Perfect weather is subjective. On this map perfect weather has been defined with temperatures between 20°C (68°F) and 29°C (84°F) and not too much precipitation (less than 90 mm (3.5 in) a month).
In September the weather in Panama ranges from less favorable in Panama City to mixed in Taboga. The temperatures range from high in Paso Ancho with 25°C (77°F) to very high in Chitré with 31°C (88°F). These night and day temperatures are an average and some days may be even warmer. So be prepared and bring light clothes.
Find more detailed climate information for Panama in September here.
Perfect weather is subjective. On this map perfect weather has been defined with temperatures between 20°C (68°F) and 29°C (84°F) and not too much precipitation (less than 90 mm (3.5 in) a month).
In October the weather in Panama ranges from less favorable in Panama City to mixed in Playa Blanca. The temperatures range from high in Cerro Punta with 25°C (77°F) to very high in Chitré with 31°C (88°F). These night and day temperatures are an average and some days may be even warmer. So be prepared and bring light clothes.
Find more detailed climate information for Panama in October here.
Perfect weather is subjective. On this map perfect weather has been defined with temperatures between 20°C (68°F) and 29°C (84°F) and not too much precipitation (less than 90 mm (3.5 in) a month).
In November the weather in Panama ranges from less favorable in Bocas del Toro to mixed in Panama City. The temperatures range from high in Cerro Punta with 25°C (77°F) to very high in Chitré with 31°C (88°F). These night and day temperatures are an average and some days may be even warmer. So be prepared and bring light clothes.
Find more detailed climate information for Panama in November here.
Perfect weather is subjective. On this map perfect weather has been defined with temperatures between 20°C (68°F) and 29°C (84°F) and not too much precipitation (less than 90 mm (3.5 in) a month).
In December the weather in Panama ranges from less favorable in Bocas del Toro to very good in Playa Blanca. The temperatures range from high in Cerro Punta with 24°C (75°F) to very high in Santiago with 32°C (90°F). These night and day temperatures are an average and some days may be even warmer. So be prepared and bring light clothes.
Find more detailed climate information for Panama in December here.
Perfect weather is subjective. On this map perfect weather has been defined with temperatures between 20°C (68°F) and 29°C (84°F) and not too much precipitation (less than 90 mm (3.5 in) a month).
More climate information for the top 10 destinations in Panama:
Need travel inspiration? Check out our bucket list articles and be inspired.
Discover the San Blas Islands
The San Blas Islands are among the most beautiful islands in the Caribbean and perhaps even in the world. These tropical pearls are located in the north of Panama.

 The top 5 unexplored rainforests in Central America
Dive into Central America's top 5 hidden rainforests for an unparalleled journey through vibrant wildlife and diverse landscapes.