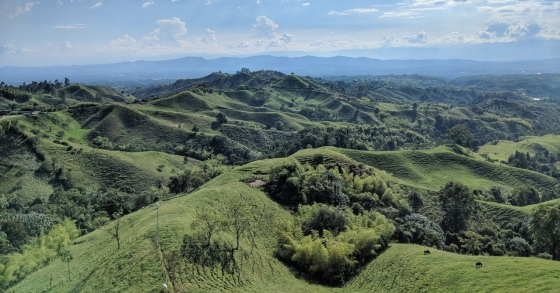
 Breathtaking view in Minca
Minca is a tiny village in the tropical rain forest of Colombia and is an oasis of tranquility. Everyone looking for a relatively undiscovered piece of Colombia is in the right place here.
Magdalena is a region in Colombia. Many people wonder what the weather conditions are in Magdalena over the year. What is the best time to visit Magdalena?
This page shows the average weather conditions by month in Magdalena over the year in: January, February, March, April, May, June, July, August, September, October, November, December.
Perfect weather is subjective. On this map perfect weather has been defined with temperatures between 20°C (68°F) and 29°C (84°F) and not too much precipitation (less than 90 mm (3.5 in) a month).
Perfect weather is subjective. On this map perfect weather has been defined with temperatures between 20°C (68°F) and 29°C (84°F) and not too much precipitation (less than 90 mm (3.5 in) a month).
Perfect weather is subjective. On this map perfect weather has been defined with temperatures between 20°C (68°F) and 29°C (84°F) and not too much precipitation (less than 90 mm (3.5 in) a month).
In April the weather in Magdalena ranges from very good in Santa Marta to excellent in Taganga. The average maximum daytime temperatures are high and range from 27°C (81°F) in Jordán to 29°C (84°F) in Ciénaga.
Find more detailed climate information for Magdalena in April here.
Perfect weather is subjective. On this map perfect weather has been defined with temperatures between 20°C (68°F) and 29°C (84°F) and not too much precipitation (less than 90 mm (3.5 in) a month).
In May the weather in Magdalena ranges from less favorable in Minca to very good in Taganga. In Santa Marta you can expect warm maximum average daytime temperatures around 29°C (84°F) and nighttime temperatures around 25°C (77°F).
Find more detailed climate information for Magdalena in May here.
Perfect weather is subjective. On this map perfect weather has been defined with temperatures between 20°C (68°F) and 29°C (84°F) and not too much precipitation (less than 90 mm (3.5 in) a month).
In June the weather in Magdalena ranges from less favorable in Minca to very good in Taganga. In Santa Marta you can expect warm maximum average daytime temperatures around 29°C (84°F) and nighttime temperatures around 26°C (79°F). These night and day temperatures are an average and some days may be even warmer. So be prepared and bring light clothes.
Find more detailed climate information for Magdalena in June here.
Perfect weather is subjective. On this map perfect weather has been defined with temperatures between 20°C (68°F) and 29°C (84°F) and not too much precipitation (less than 90 mm (3.5 in) a month).
In July the weather in Magdalena ranges from less favorable in Minca to very good in Santa Marta. The average maximum daytime temperatures are high and range from 28°C (82°F) in Jordán to 30°C (86°F) in Ciénaga. These night and day temperatures are an average and some days may be even warmer. So be prepared and bring light clothes.
Find more detailed climate information for Magdalena in July here.
Perfect weather is subjective. On this map perfect weather has been defined with temperatures between 20°C (68°F) and 29°C (84°F) and not too much precipitation (less than 90 mm (3.5 in) a month).
In August the weather in Magdalena ranges from less favorable in Minca to very good in Santa Marta. In Santa Marta you can expect warm maximum average daytime temperatures around 29°C (84°F) and nighttime temperatures around 26°C (79°F). These night and day temperatures are an average and some days may be even warmer. So be prepared and bring light clothes.
Find more detailed climate information for Magdalena in August here.
Perfect weather is subjective. On this map perfect weather has been defined with temperatures between 20°C (68°F) and 29°C (84°F) and not too much precipitation (less than 90 mm (3.5 in) a month).
In September the weather in Magdalena ranges from less favorable in Minca to good in Taganga. In Santa Marta you can expect warm maximum average daytime temperatures around 29°C (84°F) and nighttime temperatures around 25°C (77°F). These night and day temperatures are an average and some days may be even warmer. So be prepared and bring light clothes.
Find more detailed climate information for Magdalena in September here.
Perfect weather is subjective. On this map perfect weather has been defined with temperatures between 20°C (68°F) and 29°C (84°F) and not too much precipitation (less than 90 mm (3.5 in) a month).
In October the weather in Magdalena ranges from less favorable in Santa Marta to mixed in Taganga. In Santa Marta you can expect warm maximum average daytime temperatures around 29°C (84°F) and nighttime temperatures around 25°C (77°F).
Find more detailed climate information for Magdalena in October here.
Perfect weather is subjective. On this map perfect weather has been defined with temperatures between 20°C (68°F) and 29°C (84°F) and not too much precipitation (less than 90 mm (3.5 in) a month).
In November the weather in Magdalena ranges from less favorable in Ciénaga to very good in Taganga. In Santa Marta you can expect warm maximum average daytime temperatures around 29°C (84°F) and nighttime temperatures around 25°C (77°F).
Find more detailed climate information for Magdalena in November here.
Perfect weather is subjective. On this map perfect weather has been defined with temperatures between 20°C (68°F) and 29°C (84°F) and not too much precipitation (less than 90 mm (3.5 in) a month).
In December the weather in Magdalena ranges from very good in Minca to excellent in Santa Marta. The average maximum daytime temperatures are high and range from 27°C (81°F) in Jordán to 29°C (84°F) in Ciénaga.
Find more detailed climate information for Magdalena in December here.
Perfect weather is subjective. On this map perfect weather has been defined with temperatures between 20°C (68°F) and 29°C (84°F) and not too much precipitation (less than 90 mm (3.5 in) a month).
More climate information for the top 5 destinations in Magdalena:
Need travel inspiration? Check out our bucket list articles and be inspired.
Breathtaking view in Minca
Minca is a tiny village in the tropical rain forest of Colombia and is an oasis of tranquility. Everyone looking for a relatively undiscovered piece of Colombia is in the right place here.
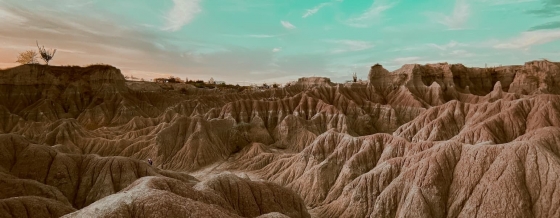 5 Hidden Gems in Colombia
Explore Colombia's hidden gems, from El Cocuy's remote beauty to Providencia's serene beaches, offering authentic experiences off the beaten path.
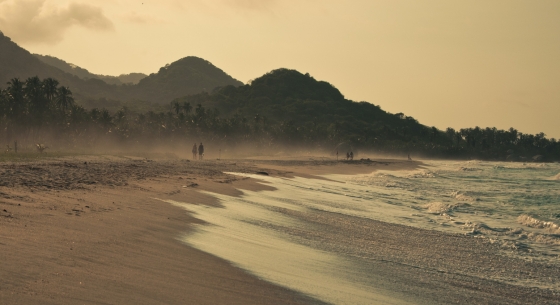 Tayrona National Park: the most beautiful part of Colombia
Visit the park between the months December and March (not February since it is closed) or from June till August (this is high season).
Breathtaking view in Minca
Minca is a tiny village in the tropical rain forest of Colombia and is an oasis of tranquility. Everyone looking for a relatively undiscovered piece of Colombia is in the right place here.