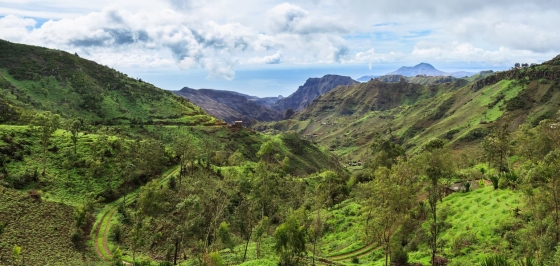
 Cape Verde: Discover the largest island of Santiago
Uncover the hidden gem of Santiago—stunning beaches, cultural immersion, and an authentic African atmosphere await. Escape the crowds and explore this untouched paradise.
Santiago Island is a region in Cape Verde. Many people wonder what the weather conditions are in Santiago Island over the year. What is the best time to visit Santiago Island?
This page shows the average weather conditions by month in Santiago Island over the year in: January, February, March, April, May, June, July, August, September, October, November, December.
Perfect weather is subjective. On this map perfect weather has been defined with temperatures between 20°C (68°F) and 29°C (84°F) and not too much precipitation (less than 90 mm (3.5 in) a month).
In February the weather in Santiago Island is generally excellent. In Praia you can expect warm maximum average daytime temperatures around 25°C (77°F) and nighttime temperatures around 20°C (68°F). On average, this month is the coldest month of the year in Santiago Island.
Find more detailed climate information for Santiago Island in February here.
Perfect weather is subjective. On this map perfect weather has been defined with temperatures between 20°C (68°F) and 29°C (84°F) and not too much precipitation (less than 90 mm (3.5 in) a month).
In March the weather in Santiago Island is generally excellent. The average maximum daytime temperatures are high and range from 24°C (75°F) in Tarrafal to 26°C (79°F) in Cidade Velha.
Find more detailed climate information for Santiago Island in March here.
Perfect weather is subjective. On this map perfect weather has been defined with temperatures between 20°C (68°F) and 29°C (84°F) and not too much precipitation (less than 90 mm (3.5 in) a month).
In April the weather in Santiago Island is generally excellent. The average maximum daytime temperatures are high and range from 24°C (75°F) in Tarrafal to 26°C (79°F) in Cidade Velha.
Find more detailed climate information for Santiago Island in April here.
Perfect weather is subjective. On this map perfect weather has been defined with temperatures between 20°C (68°F) and 29°C (84°F) and not too much precipitation (less than 90 mm (3.5 in) a month).
In May the weather in Santiago Island is generally excellent. The average maximum daytime temperatures are high and range from 24°C (75°F) in Tarrafal to 27°C (81°F) in Cidade Velha.
Find more detailed climate information for Santiago Island in May here.
Perfect weather is subjective. On this map perfect weather has been defined with temperatures between 20°C (68°F) and 29°C (84°F) and not too much precipitation (less than 90 mm (3.5 in) a month).
In June the weather in Santiago Island is generally excellent. The average maximum daytime temperatures are high and range from 25°C (77°F) in Tarrafal to 27°C (81°F) in Cidade Velha.
Find more detailed climate information for Santiago Island in June here.
Perfect weather is subjective. On this map perfect weather has been defined with temperatures between 20°C (68°F) and 29°C (84°F) and not too much precipitation (less than 90 mm (3.5 in) a month).
In July the weather in Santiago Island is generally excellent. The average maximum daytime temperatures are high and range from 26°C (79°F) in Tarrafal to 28°C (82°F) in Cidade Velha.
Find more detailed climate information for Santiago Island in July here.
Perfect weather is subjective. On this map perfect weather has been defined with temperatures between 20°C (68°F) and 29°C (84°F) and not too much precipitation (less than 90 mm (3.5 in) a month).
Perfect weather is subjective. On this map perfect weather has been defined with temperatures between 20°C (68°F) and 29°C (84°F) and not too much precipitation (less than 90 mm (3.5 in) a month).
In September the weather in Santiago Island is generally excellent. In Praia you can expect warm maximum average daytime temperatures around 29°C (84°F) and nighttime temperatures around 25°C (77°F). On average, this month is one of the warmest months of the year in Santiago Island. So be prepared and make sure to dress lightly.
Find more detailed climate information for Santiago Island in September here.
Perfect weather is subjective. On this map perfect weather has been defined with temperatures between 20°C (68°F) and 29°C (84°F) and not too much precipitation (less than 90 mm (3.5 in) a month).
In October the weather in Santiago Island is generally excellent. In Praia you can expect warm maximum average daytime temperatures around 29°C (84°F) and nighttime temperatures around 25°C (77°F). These night and day temperatures are an average and some days may be even warmer. So be prepared and bring light clothes.
Find more detailed climate information for Santiago Island in October here.
Perfect weather is subjective. On this map perfect weather has been defined with temperatures between 20°C (68°F) and 29°C (84°F) and not too much precipitation (less than 90 mm (3.5 in) a month).
Perfect weather is subjective. On this map perfect weather has been defined with temperatures between 20°C (68°F) and 29°C (84°F) and not too much precipitation (less than 90 mm (3.5 in) a month).
Perfect weather is subjective. On this map perfect weather has been defined with temperatures between 20°C (68°F) and 29°C (84°F) and not too much precipitation (less than 90 mm (3.5 in) a month).
More climate information for the top 4 destinations in Santiago Island:
Need travel inspiration? Check out our bucket list articles and be inspired.
Cape Verde: Discover the largest island of Santiago
Uncover the hidden gem of Santiago—stunning beaches, cultural immersion, and an authentic African atmosphere await. Escape the crowds and explore this untouched paradise.
Cape Verde: Discover the largest island of Santiago
Uncover the hidden gem of Santiago—stunning beaches, cultural immersion, and an authentic African atmosphere await. Escape the crowds and explore this untouched paradise.