Average monthly snow and rainfall in Biograd na Moru
The mean monthly precipitation over the year in Biograd na Moru (Zadar County), including rain, snow, hail.
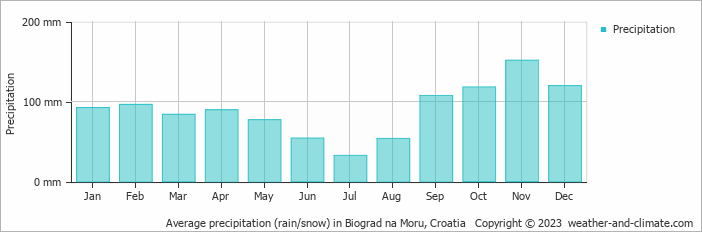
- A lot of rain (rainy season) falls in the months: September, October, November and December.
- On average, November is the wettest month with 151 mm of precipitation.
- On average, July is the driest month with 32 mm of precipitation.
- The average amount of annual precipitation is 1075 mm.
Weather Forecasts for Biograd na Moru
Fri May 03
18°C | 12°C
W  18 km/h
18 km/hpartly cloudy and no rain
Sat May 04
21°C | 9°C
NW 22 km/h
22 km/h0.3 mm
partly cloudy and small chance of slight rain
Sun May 05
22°C | 11°C
W 14 km/h
14 km/hclear and no rain


