Average temperature in Klong Muang Beach
The mean minimum and maximum temperatures over the year in Klong Muang Beach (Krabi Province), Thailand.
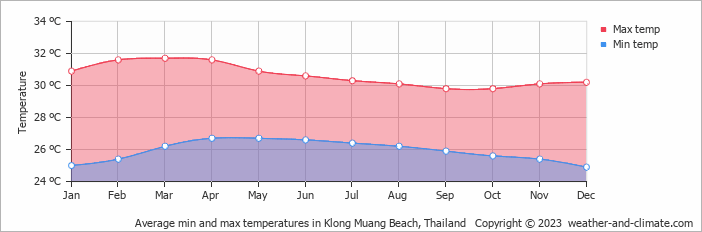
- The months of September and October have nice average temperatures.
- On average, the temperatures are always high.
- On average, the warmest month is March with 32°C.
- On average, the coolest month is October with 30°C.
- The average annual maximum temperature is 31°C.
- The average annual minimum temperature is 26°C.
Weather Forecasts for Klong Muang Beach
Sat May 04
37°C | 27°C
SW  11 km/h
11 km/h3.6 mm
partly cloudy and chance of rain
Sun May 05
37°C | 26°C
SW 11 km/h
11 km/h8.5 mm
partly cloudy and thunder
Mon May 06
36°C | 26°C
S 11 km/h
11 km/h5.7 mm
partly cloudy and thunder