Average monthly rainy days in Dayr al Qamar
The number of days each month with rain, snow and hail in Dayr al Qamar (Mount Lebanon), Lebanon.
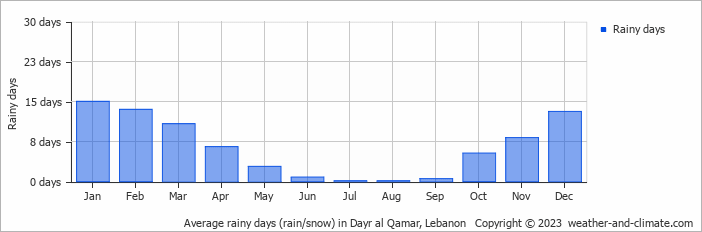
- Most rainy days are in January.
- Dayr al Qamar has dry periods in June, July, August and September.
- On average, January is the most rainy with 15 days of rain/snow.
- On average, July is the driest month with 0 rainy days.
- The average annual number of rainy days is 76.
Weather Forecasts for Dayr al Qamar
Sat May 04
20°C | 14°C
SW  22 km/h
22 km/hclear and no rain
Sun May 05
18°C | 12°C
SW 22 km/h
22 km/h6.4 mm
partly cloudy and chance of rain
Mon May 06
18°C | 11°C
SW 14 km/h
14 km/h11 mm
broken clouds and thunder


