Average monthly rainy days in Burgberg
The number of days each month with rain, snow and hail in Burgberg (Bavaria), Germany.
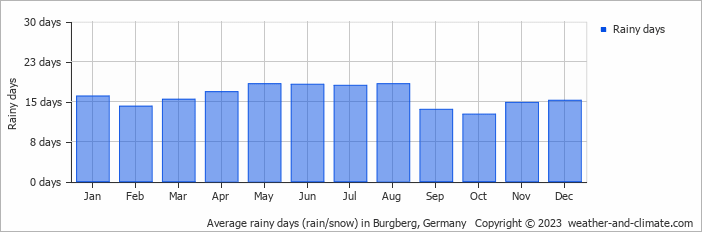
- Most rainy days are in January, March, April, May, June, July, August and December.
- On average, August is the most rainy with 18 days of rain/snow.
- On average, October is the driest month with 12 rainy days.
- The average annual number of rainy days is 191.
Forecast for Burgberg
Mon May 06
19°C | 5°C
W  11 km/h
11 km/h7.9 mm
broken clouds and thunder
Tue May 07
13°C | 6°C
NE 11 km/h
11 km/h2.6 mm
overcast and rain
Wed May 08
13°C | 7°C
N 11 km/h
11 km/h4.7 mm
broken clouds and rain