ClimateForecastAprilMay >>

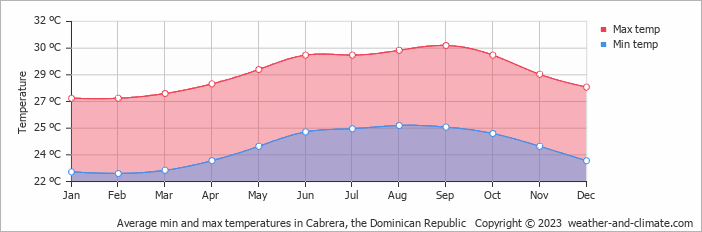
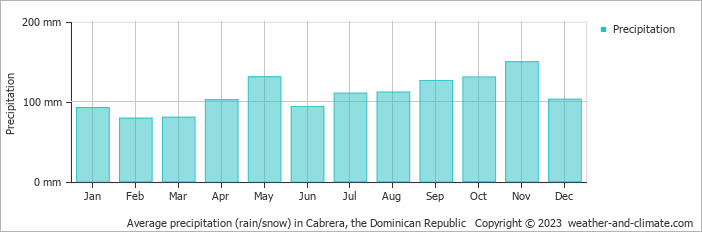
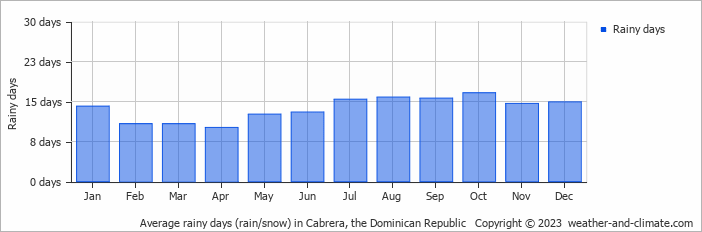
Climate in Cabrera, Dominican Republic

The graphs below show the monthly weather averages over the year.

Average day and night temperature

The mean minimum and maximum temperatures over the year.

Average monthly minimum and maximum temperature in Cabrera, the Dominican Republic

Feel free to add this climate graph to your website. Click the copy button above.

Monthly precipitation

The mean monthly precipitation over the year, including rain, snow, hail etc.

Average monthly rainfall, snow, precipitation in Cabrera, the Dominican Republic

Feel free to add this climate graph to your website. Click the copy button above.

Monthly rainy days

The average number of days each month with rain, snow, hail etc.

Average monthly rainy days in Cabrera, the Dominican Republic

Feel free to add this climate graph to your website. Click the copy button above.

Weather Forecasts for Cabrera

Thu   Apr 18
28°C | 20°C
NE 18 km/h
3.3 mm
partly cloudy and  chance of rain

partly cloudy and chance of rain

Fri   Apr 19
28°C | 20°C
NE 18 km/h
2.2 mm
partly cloudy and  chance of rain

partly cloudy and chance of rain

Sat   Apr 20
27°C | 20°C
E 22 km/h
2.6 mm
partly cloudy and rain

partly cloudy and rain

The best time of year to visit Cabrera in the Dominican Republic

Other facts from our historical weather data:

  • Which is the hottest month in Cabrera?
    September has an average maximum temperature of 31°C and is the hottest month of the year.
  • Which is the coolest month in Cabrera?
    The coolest month is February with an average maximum temperature of 27°C.
  • Which is the wettest month in Cabrera?
    November tops the wettest month list with 149 mm of rainfall.
  • Which is the driest month in Cabrera?
    February is the driest month with 79 mm of precipitation.

  • No idea where to travel to this year? We have a tool that recommends destinations based on your ideal conditions. Find out where to go with our weather planner.