Average monthly snow and rainfall in Viña del Mar
The mean monthly precipitation over the year in Viña del Mar (Valparaíso Region), including rain, snow, hail.
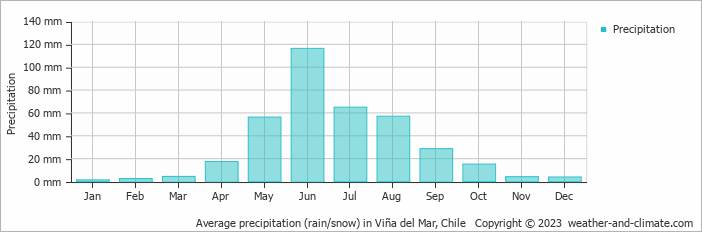
- Most rainfall (rainy season) is seen in June.
- Viña del Mar has dry periods in January, February, March, April, October, November and December.
- On average, June is the wettest month with 116 mm of precipitation.
- On average, January is the driest month with 1 mm of precipitation.
- The average amount of annual precipitation is 371 mm.
Weather Forecasts for Viña del Mar
Wed Apr 24
19°C | 7°C
SW  18 km/h
18 km/halmost clear and no rain
Thu Apr 25
22°C | 6°C
SW 18 km/h
18 km/hpartly cloudy and no rain
Fri Apr 26
22°C | 8°C
SW 22 km/h
22 km/hpartly cloudy and no rain