Average monthly snow and rainfall in Villarrica
The mean monthly precipitation over the year in Villarrica (Araucanía), including rain, snow, hail.
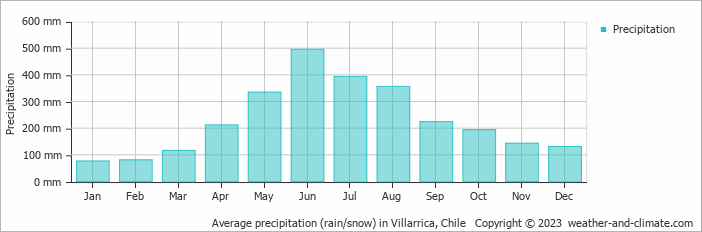
- A lot of rain (rainy season) falls in the months: March, April, May, June, July, August, September, October, November and December.
- On average, June is the wettest month with 495 mm of precipitation.
- On average, January is the driest month with 76 mm of precipitation.
- The average amount of annual precipitation is 2754 mm.
Weather Forecasts for Villarrica
Tue Apr 23
14°C | 6°C
NW  4 km/h
4 km/h2.1 mm
partly cloudy and chance of slight rain
Wed Apr 24
12°C | 4°C
NE 22 km/h
22 km/h37 mm
overcast and heavy rain
Thu Apr 25
13°C | 7°C
NW 22 km/h
22 km/h44 mm
broken clouds and rain