ClimateForecastAprilMay >>

Average monthly snow and rainfall in Viljandi

The mean monthly precipitation over the year in Viljandi (Viljandimaa), including rain, snow, hail.

Average monthly rainfall, snow, precipitation in Viljandi,

Feel free to add this climate graph to your website. Click the copy button above.

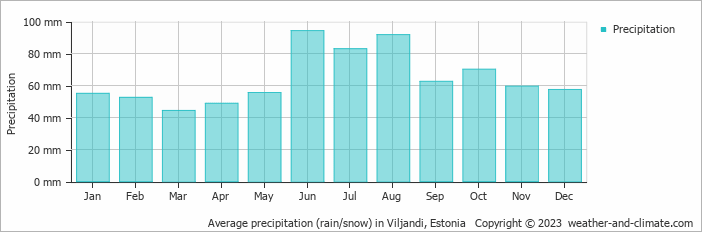
  • On average, June is the wettest month with 94 mm of precipitation.
  • On average, March is the driest month with 44 mm of precipitation.
  • The average amount of annual precipitation is 774 mm.

Weather Forecasts for Viljandi

Sat   Apr 20
5°C | -3°C
SW 22 km/h
0.5 mm
overcast and small chance of slight snow

overcast and small chance of slight snow

Sun   Apr 21
7°C | -3°C
NE 11 km/h
broken clouds and no rain

broken clouds and no rain

Mon   Apr 22
3°C | 0°C
N 25 km/h
9 mm
overcast and heavy rain

overcast and heavy rain

Interested in more climate information?

Weather and Climate provides you with all the information you need about the climate in Viljandi.

Our site offers climate and forecast data for every country in the world. Are you going to Estonia? On this website you can find historical weather averages for many cities in Estonia. Not sure yet where to go? We now have a tool which recommends destinations that suit your ideal climate conditions. Find out where to go with our weather planner.