Average monthly snow and rainfall in Umm Al Quwain
The mean monthly precipitation over the year in Umm Al Quwain (Umm al-Quwain), including rain, snow, hail.
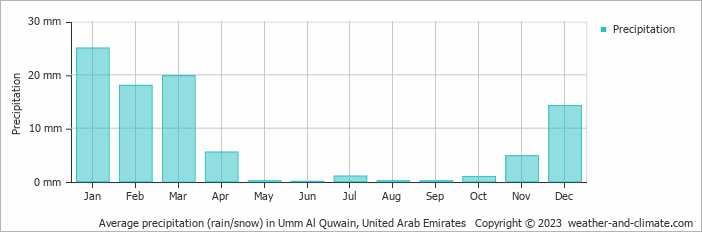
- Umm Al Quwain has dry periods in January, February, March, April, May, June, July, August, September, October, November and December.
- On average, January is the wettest month with 25 mm of precipitation.
- On average, June is the driest month with 0 mm of precipitation.
- The average amount of annual precipitation is 90 mm.
Weather Forecasts for Umm Al Quwain
Thu Apr 25
31°C | 20°C
N  22 km/h
22 km/hclear and no rain
Fri Apr 26
33°C | 22°C
N 32 km/h
32 km/hclear and no rain
Sat Apr 27
35°C | 22°C
NE 25 km/h
25 km/hclear and no rain


