Average monthly snow and rainfall in Tiberias (North District Israel) in inches

This is the mean monthly precipitation over the year, including rain, snow, hail etc.
Show average precipitation in Tiberias in Millimeter »

Average precipitation (rain/snow) in Tiberias, Israel   Copyright © 2023  weather-and-climate.com

Feel free to add this climate graph to your website. Click the copy button above.

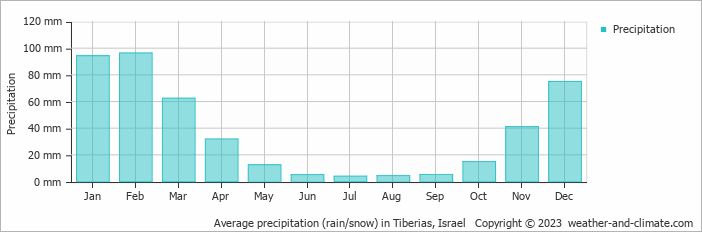
  • Tiberias has dry periods in May, June, July, August, September and October.
  • On average, February is the wettest month with 3.8 inches (96 mm) of precipitation.
  • On average, July is the driest month with 0.2 inches (4 mm) of precipitation.
  • The average amount of annual precipitation is: 17.6 inches (446 mm)

Weather Forecasts for Tiberias (North District Israel)

Fri   Dec 08
70°F | 55°F
E 2 mph
broken clouds and no rain

broken clouds and no rain

Sat   Dec 09
61°F | 54°F
SW 2 mph
0.5 inches
broken clouds and rain

broken clouds and rain

Sun   Dec 10
70°F | 52°F
E 4 mph
broken clouds and no rain

broken clouds and no rain

Interested in more climate information?

Weather and Climate provides you with all the information you need about the climate in Tiberias.

Our site offers climate and forecast data for every country in the world. Are you going to Israel? On this website you can find historical weather averages for many cities in Israel. Not sure yet where to go? We now have a tool which recommends destinations that suit your ideal climate conditions. Find out where to go with our weather planner.