ClimateForecastAprilMay >>

Average monthly snow and rainfall in Tarquinia

The mean monthly precipitation over the year in Tarquinia (Lazio), including rain, snow, hail.

Average monthly rainfall, snow, precipitation in Tarquinia,

Feel free to add this climate graph to your website. Click the copy button above.

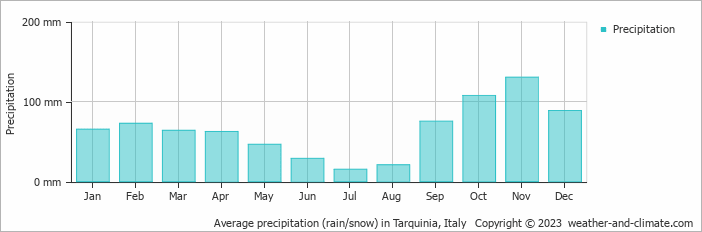
  • Most rainfall (rainy season) is seen in October and November.
  • Tarquinia has dry periods in July and August.
  • On average, November is the wettest month with 130 mm of precipitation.
  • On average, July is the driest month with 15 mm of precipitation.
  • The average amount of annual precipitation is 776 mm.

Weather Forecasts for Tarquinia

Fri   Apr 19
19°C | 7°C
NE 32 km/h
clear and no rain

clear and no rain

Sat   Apr 20
16°C | 7°C
NW 22 km/h
1.8 mm
partly cloudy and thunder

partly cloudy and thunder

Sun   Apr 21
17°C | 8°C
NE 22 km/h
clear and no rain

clear and no rain

Interested in more climate information?

Weather and Climate provides you with all the information you need about the climate in Tarquinia.

Our site offers climate and forecast data for every country in the world. Are you going to Italy? On this website you can find historical weather averages for many cities in Italy. Not sure yet where to go? We now have a tool which recommends destinations that suit your ideal climate conditions. Find out where to go with our weather planner.