Average monthly snow and rainfall in Tab Kaek Beach
The mean monthly precipitation over the year in Tab Kaek Beach (Krabi Province), including rain, snow, hail.
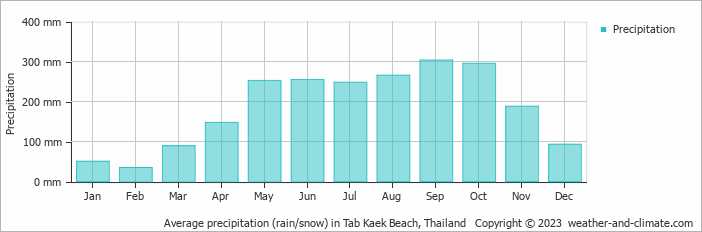
- A lot of rain (rainy season) falls in the months: April, May, June, July, August, September, October and November.
- On average, September is the wettest month with 303 mm of precipitation.
- On average, February is the driest month with 34 mm of precipitation.
- The average amount of annual precipitation is 2219 mm.
Weather Forecasts for Tab Kaek Beach
Wed Apr 24
35°C | 28°C
SW  18 km/h
18 km/hbroken clouds and no rain
Thu Apr 25
35°C | 28°C
SW 18 km/h
18 km/h3.4 mm
broken clouds and thunder
Fri Apr 26
35°C | 28°C
SW 14 km/h
14 km/h1 mm
partly cloudy and slight rain