Average monthly snow and rainfall in San Juan del Sur
The mean monthly precipitation over the year in San Juan del Sur (Rivas Region), including rain, snow, hail.
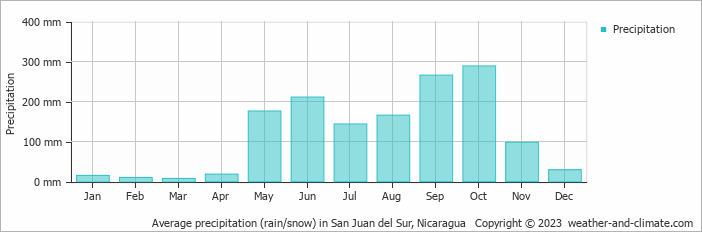
- A lot of rain (rainy season) falls in the months: May, June, July, August, September and October.
- San Juan del Sur has dry periods in January, February, March and April.
- On average, October is the wettest month with 289 mm of precipitation.
- On average, March is the driest month with 7 mm of precipitation.
- The average amount of annual precipitation is 1426 mm.
Weather Forecasts for San Juan del Sur
Fri Apr 19
34°C | 26°C
E  25 km/h
25 km/hbroken clouds and no rain
Sat Apr 20
34°C | 25°C
E 22 km/h
22 km/hbroken clouds and no rain
Sun Apr 21
34°C | 25°C
NE 18 km/h
18 km/h4.4 mm
clear and small chance of rain