Average monthly snow and rainfall in San José Pinula
The mean monthly precipitation over the year in San José Pinula (Guatemala), including rain, snow, hail.
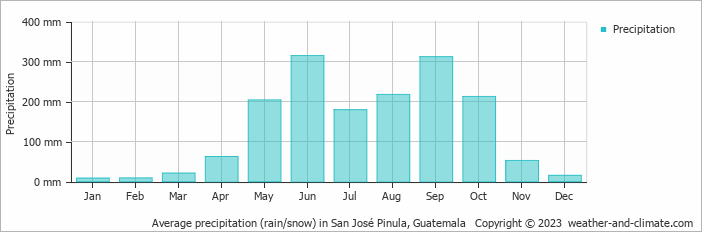
- A lot of rain (rainy season) falls in the months: May, June, July, August, September and October.
- San José Pinula has dry periods in January, February, March and December.
- On average, June is the wettest month with 314 mm of precipitation.
- On average, January is the driest month with 8 mm of precipitation.
- The average amount of annual precipitation is 1604 mm.
Weather Forecasts for San José Pinula
Sat Apr 20
27°C | 17°C
S  11 km/h
11 km/h1.1 mm
partly cloudy and chance of rain
Sun Apr 21
26°C | 17°C
S 11 km/h
11 km/h3.8 mm
broken clouds and rain
Mon Apr 22
28°C | 17°C
N 11 km/h
11 km/h3.2 mm
broken clouds and thunder


