Average monthly snow and rainfall in San José del Cabo
The mean monthly precipitation over the year in San José del Cabo (Baja California Sur), including rain, snow, hail.
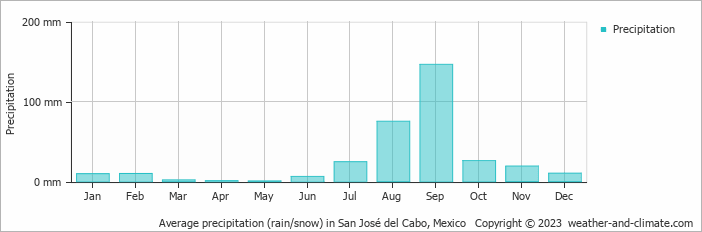
- Most rainfall (rainy season) is seen in September.
- San José del Cabo has dry periods in January, February, March, April, May, June, July, November and December.
- On average, September is the wettest month with 146 mm of precipitation.
- On average, May is the driest month with 1 mm of precipitation.
- The average amount of annual precipitation is 329 mm.
Weather Forecasts for San José del Cabo
Sat Apr 20
31°C | 17°C
SE  25 km/h
25 km/hclear and no rain
Sun Apr 21
32°C | 19°C
S 25 km/h
25 km/hclear and no rain
Mon Apr 22
33°C | 20°C
S 29 km/h
29 km/hclear and no rain


