Average monthly snow and rainfall in Qujing
The mean monthly precipitation over the year in Qujing (), including rain, snow, hail.
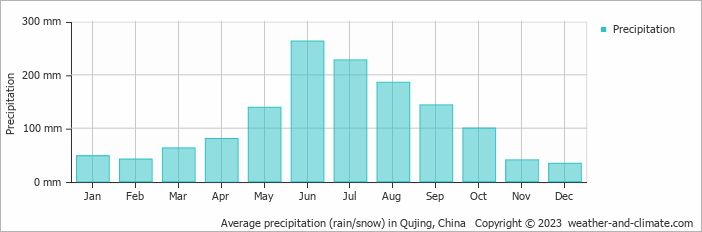
- A lot of rain (rainy season) falls in the months: May, June, July, August and September.
- On average, June is the wettest month with 263 mm of precipitation.
- On average, December is the driest month with 34 mm of precipitation.
- The average amount of annual precipitation is 1365 mm.
Weather Forecasts for Qujing
Tue Apr 23
19°C | 12°C
SE  18 km/h
18 km/h11 mm
overcast and rain
Wed Apr 24
29°C | 12°C
W 36 km/h
36 km/hpartly cloudy and no rain
Thu Apr 25
28°C | 15°C
W 32 km/h
32 km/halmost clear and no rain


