ClimateForecastAprilMay >>

Average monthly snow and rainfall in Punta Rucia

The mean monthly precipitation over the year in Punta Rucia (Puerto Plata Province), including rain, snow, hail.

Average monthly rainfall, snow, precipitation in Punta Rucia,

Feel free to add this climate graph to your website. Click the copy button above.

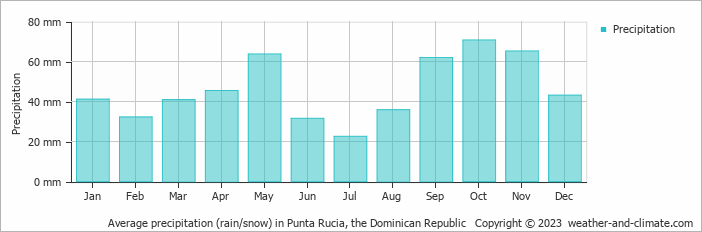
  • On average, October is the wettest month with 71 mm of precipitation.
  • On average, July is the driest month with 23 mm of precipitation.
  • The average amount of annual precipitation is 554 mm.

Weather Forecasts for Punta Rucia

Tue   Apr 16
28°C | 22°C
NE 18 km/h
9.5 mm
overcast and thunder

overcast and thunder

Wed   Apr 17
28°C | 21°C
NE 22 km/h
1.4 mm
partly cloudy and rain

partly cloudy and rain

Thu   Apr 18
28°C | 21°C
NE 22 km/h
0.6 mm
partly cloudy and  chance of slight rain

partly cloudy and chance of slight rain

Interested in more climate information?

Weather and Climate provides you with all the information you need about the climate in Punta Rucia.

Our site offers climate and forecast data for every country in the world. Are you going to the Dominican Republic? On this website you can find historical weather averages for many cities in the Dominican Republic. Not sure yet where to go? We now have a tool which recommends destinations that suit your ideal climate conditions. Find out where to go with our weather planner.