Average monthly snow and rainfall in Punta Mita
The mean monthly precipitation over the year in Punta Mita (Riviera Nayarit), including rain, snow, hail.
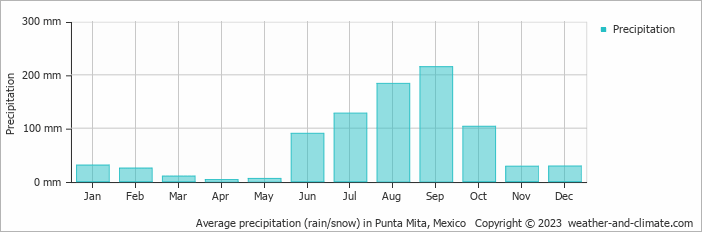
- A lot of rain (rainy season) falls in the months: July, August, September and October.
- Punta Mita has dry periods in February, March, April and May.
- On average, September is the wettest month with 215 mm of precipitation.
- On average, April is the driest month with 3 mm of precipitation.
- The average amount of annual precipitation is 850 mm.
Weather Forecasts for Punta Mita
Fri Apr 26
29°C | 22°C
N  14 km/h
14 km/hbroken clouds and no rain
Sat Apr 27
28°C | 22°C
NW 14 km/h
14 km/hpartly cloudy and no rain
Sun Apr 28
28°C | 21°C
NW 14 km/h
14 km/halmost clear and no rain


