Average monthly snow and rainfall in Port Said
The mean monthly precipitation over the year in Port Said (Port Said Governorate), including rain, snow, hail.
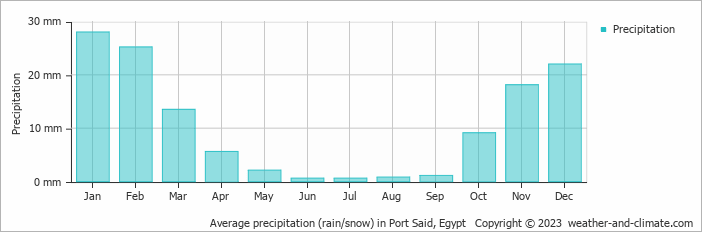
- Port Said has dry periods in March, April, May, June, July, August, September, October, November and December.
- On average, January is the wettest month with 28 mm of precipitation.
- On average, July is the driest month with 1 mm of precipitation.
- The average amount of annual precipitation is 127 mm.
Weather Forecasts for Port Said
Thu Apr 25
30°C | 22°C
NW  40 km/h
40 km/hbroken clouds and no rain
Fri Apr 26
25°C | 21°C
N 32 km/h
32 km/hpartly cloudy and no rain
Sat Apr 27
24°C | 20°C
N 29 km/h
29 km/halmost clear and no rain