Average monthly snow and rainfall in Port Mathurin (Rodrigues) in inches

This is the mean monthly precipitation over the year, including rain, snow, hail etc.
Show average precipitation in Port Mathurin in Millimeter »

Average precipitation (rain/snow) in Port Mathurin, Mauritius   Copyright © 2023  weather-and-climate.com

Feel free to add this climate graph to your website. Click the copy button above.


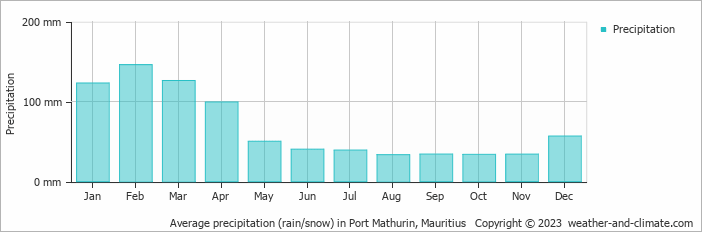
  • A lot of rain (rainy season) falls in the months: January, February, March and April.
  • On average, February is the wettest month with 6.6 inches (168 mm) of precipitation.
  • On average, October is the driest month with 1.5 inches (38 mm) of precipitation.
  • The average amount of annual precipitation is: 43.4 inches (1101 mm)


Weather Forecasts for Port Mathurin (Rodrigues)

Fri   Jun 09
81°F | 73°F
E 20 mph
0.07 inches
partly cloudy and rain

partly cloudy and rain

Sat   Jun 10
81°F | 73°F
SE 20 mph
almost clear and no rain

almost clear and no rain

Sun   Jun 11
81°F | 72°F
E 22 mph
0.09 inches
partly cloudy and rain

partly cloudy and rain

Interested in more climate information?

Weather and Climate provides you with all the information you need about the climate in Port Mathurin.

Our site offers climate and forecast data for every country in the world. Are you going to Mauritius? On this website you can find historical weather averages for many cities in Mauritius. Not sure yet where to go? We now have a tool which recommends destinations that suit your ideal climate conditions. Find out where to go with our weather planner.