Average monthly snow and rainfall in Port Macquarie
The mean monthly precipitation over the year in Port Macquarie (New South Wales), including rain, snow, hail.
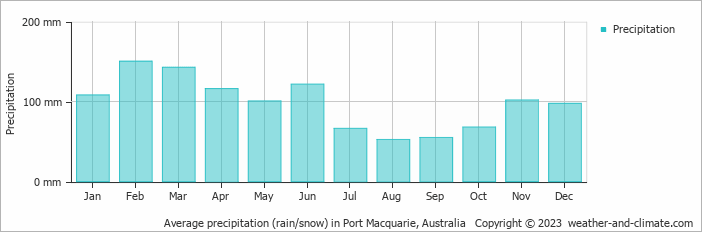
- A lot of rain (rainy season) falls in the months: January, February, March, April, May, June and November.
- On average, February is the wettest month with 150 mm of precipitation.
- On average, August is the driest month with 52 mm of precipitation.
- The average amount of annual precipitation is 1179 mm.
Weather Forecasts for Port Macquarie
Sat Apr 27
22°C | 15°C
S  14 km/h
14 km/h2.2 mm
partly cloudy and rain
Sun Apr 28
22°C | 14°C
NE 11 km/h
11 km/h0.2 mm
partly cloudy and chance of slight rain
Mon Apr 29
24°C | 14°C
N 14 km/h
14 km/h0.2 mm
partly cloudy and slight rain


