Average monthly snow and rainfall in Playa Blanca
The mean monthly precipitation over the year in Playa Blanca (), including rain, snow, hail.
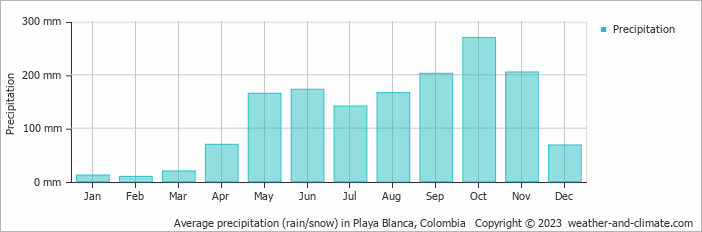
- A lot of rain (rainy season) falls in the months: May, June, July, August, September, October and November.
- Playa Blanca has dry periods in January, February and March.
- On average, October is the wettest month with 270 mm of precipitation.
- On average, February is the driest month with 9 mm of precipitation.
- The average amount of annual precipitation is 1501 mm.
Weather Forecasts for Playa Blanca
Tue Apr 23
30°C | 25°C
N  11 km/h
11 km/h8.8 mm
broken clouds and thunder
Wed Apr 24
32°C | 26°C
N 22 km/h
22 km/h6.1 mm
broken clouds and thunder
Thu Apr 25
32°C | 26°C
SE 14 km/h
14 km/h8.2 mm
broken clouds and thunder