ClimateForecastAprilMay >>

Average monthly snow and rainfall in Pickering

The mean monthly precipitation over the year in Pickering (North Yorkshire), including rain, snow, hail.

Average monthly rainfall, snow, precipitation in Pickering,

Feel free to add this climate graph to your website. Click the copy button above.

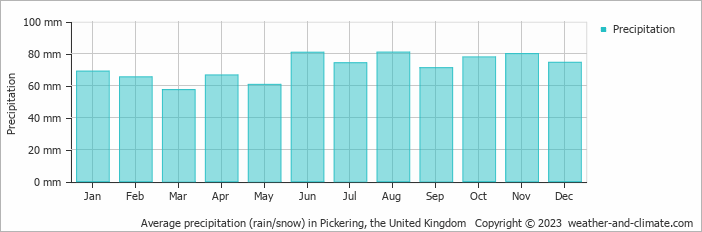
  • On average, August is the wettest month with 81 mm of precipitation.
  • On average, March is the driest month with 57 mm of precipitation.
  • The average amount of annual precipitation is 857 mm.

Weather Forecasts for Pickering

Fri   Apr 19
10°C | 3°C
N 29 km/h
0.4 mm
partly cloudy and slight rain

partly cloudy and slight rain

Sat   Apr 20
7°C | 2°C
N 29 km/h
broken clouds and no rain

broken clouds and no rain

Sun   Apr 21
8°C | 2°C
NE 18 km/h
broken clouds and no rain

broken clouds and no rain

Interested in more climate information?

Weather and Climate provides you with all the information you need about the climate in Pickering.

Our site offers climate and forecast data for every country in the world. Are you going to the United Kingdom? On this website you can find historical weather averages for many cities in the United Kingdom. Not sure yet where to go? We now have a tool which recommends destinations that suit your ideal climate conditions. Find out where to go with our weather planner.