Average monthly snow and rainfall in Oyster Pond
The mean monthly precipitation over the year in Oyster Pond (), including rain, snow, hail.
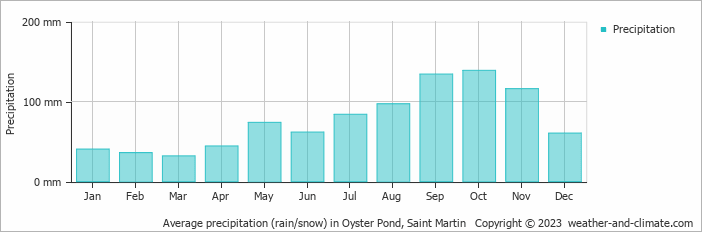
- A lot of rain (rainy season) falls in the months: September, October and November.
- On average, October is the wettest month with 139 mm of precipitation.
- On average, March is the driest month with 32 mm of precipitation.
- The average amount of annual precipitation is 917 mm.
Weather Forecasts for Oyster Pond
Thu Apr 25
31°C | 26°C
E  29 km/h
29 km/halmost clear and no rain
Fri Apr 26
30°C | 26°C
E 22 km/h
22 km/h0.7 mm
broken clouds and small chance of slight rain
Sat Apr 27
30°C | 26°C
E 18 km/h
18 km/h0.3 mm
broken clouds and small chance of slight rain


