Average monthly snow and rainfall in Noordwijk aan Zee
The mean monthly precipitation over the year in Noordwijk aan Zee (Zuid-Holland), including rain, snow, hail.
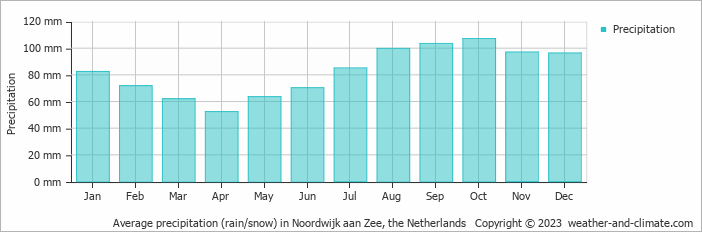
- Most rainfall (rainy season) is seen in September and October.
- On average, October is the wettest month with 107 mm of precipitation.
- On average, April is the driest month with 52 mm of precipitation.
- The average amount of annual precipitation is 991 mm.
Weather Forecasts for Noordwijk aan Zee
Tue Apr 23
8°C | -1°C
W  18 km/h
18 km/h1.1 mm
partly cloudy and small chance of slight rain
Wed Apr 24
9°C | 4°C
NW 36 km/h
36 km/h5 mm
partly cloudy and rain
Thu Apr 25
9°C | 5°C
SW 25 km/h
25 km/h4.6 mm
overcast and rain


