ClimateForecastAprilMay >>

Average monthly snow and rainfall in Murwillumbah

The mean monthly precipitation over the year in Murwillumbah (New South Wales), including rain, snow, hail.

Average monthly rainfall, snow, precipitation in Murwillumbah,

Feel free to add this climate graph to your website. Click the copy button above.

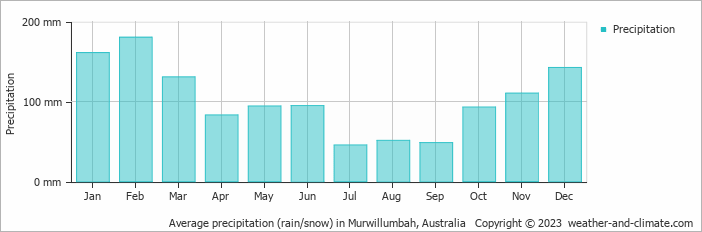
  • A lot of rain (rainy season) falls in the months: January, February, March, November and December.
  • On average, February is the wettest month with 180 mm of precipitation.
  • On average, July is the driest month with 46 mm of precipitation.
  • The average amount of annual precipitation is 1234 mm.

Weather Forecasts for Murwillumbah

Sat   Apr 20
25°C | 15°C
S 14 km/h
9.1 mm
broken clouds and rain

broken clouds and rain

Sun   Apr 21
21°C | 15°C
SE 14 km/h
25 mm
broken clouds and rain

broken clouds and rain

Mon   Apr 22
24°C | 15°C
SE 18 km/h
7.9 mm
broken clouds and rain

broken clouds and rain

Interested in more climate information?

Weather and Climate provides you with all the information you need about the climate in Murwillumbah.

Our site offers climate and forecast data for every country in the world. Are you going to Australia? On this website you can find historical weather averages for many cities in Australia. Not sure yet where to go? We now have a tool which recommends destinations that suit your ideal climate conditions. Find out where to go with our weather planner.