Average monthly snow and rainfall in Murangʼa
The mean monthly precipitation over the year in Murangʼa (), including rain, snow, hail.
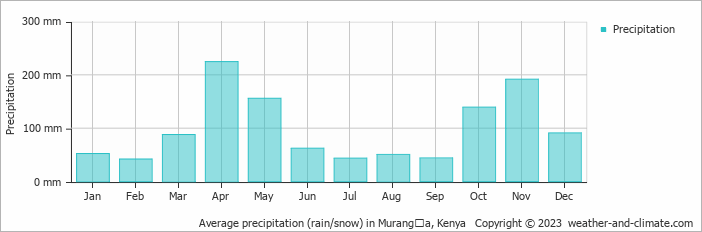
- A lot of rain (rainy season) falls in the months: April, May, October and November.
- On average, April is the wettest month with 225 mm of precipitation.
- On average, February is the driest month with 42 mm of precipitation.
- The average amount of annual precipitation is 1183 mm.
Weather Forecasts for Murangʼa
Tue Apr 23
28°C | 19°C
E  11 km/h
11 km/h11 mm
broken clouds and thunder
Wed Apr 24
27°C | 19°C
SE 7 km/h
7 km/h27 mm
broken clouds and thunder
Thu Apr 25
27°C | 18°C
E 7 km/h
7 km/h43 mm
broken clouds and thunder


