Average monthly snow and rainfall in Manglaralto
The mean monthly precipitation over the year in Manglaralto (), including rain, snow, hail.
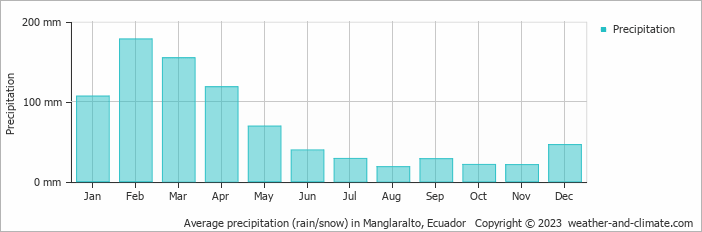
- A lot of rain (rainy season) falls in the months: January, February, March and April.
- Manglaralto has dry periods in August, October and November.
- On average, February is the wettest month with 178 mm of precipitation.
- On average, August is the driest month with 18 mm of precipitation.
- The average amount of annual precipitation is 829 mm.
Weather Forecasts for Manglaralto
Fri Apr 19
30°C | 24°C
W  18 km/h
18 km/hbroken clouds and no rain
Sat Apr 20
30°C | 24°C
W 18 km/h
18 km/hpartly cloudy and no rain
Sun Apr 21
29°C | 24°C
W 14 km/h
14 km/hpartly cloudy and no rain