Average monthly snow and rainfall in Lunahuaná
The mean monthly precipitation over the year in Lunahuaná (Provincia de Lima), including rain, snow, hail.
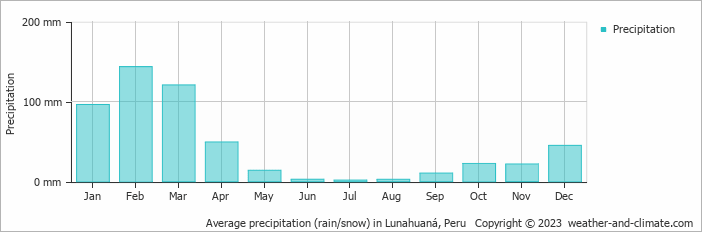
- Most rainfall (rainy season) is seen in February and March.
- Lunahuaná has dry periods in May, June, July, August, September, October and November.
- On average, February is the wettest month with 143 mm of precipitation.
- On average, July is the driest month with 2 mm of precipitation.
- The average amount of annual precipitation is 529 mm.
Weather Forecasts for Lunahuaná
Thu Apr 18
26°C | 18°C
SW  11 km/h
11 km/hbroken clouds and no rain
Fri Apr 19
25°C | 16°C
SW 11 km/h
11 km/hbroken clouds and no rain
Sat Apr 20
24°C | 16°C
SW 11 km/h
11 km/hpartly cloudy and no rain


