ClimateForecastAprilMay >>

Average monthly snow and rainfall in Los Órganos

The mean monthly precipitation over the year in Los Órganos (Piura), including rain, snow, hail.

Average monthly rainfall, snow, precipitation in Los Órganos,

Feel free to add this climate graph to your website. Click the copy button above.

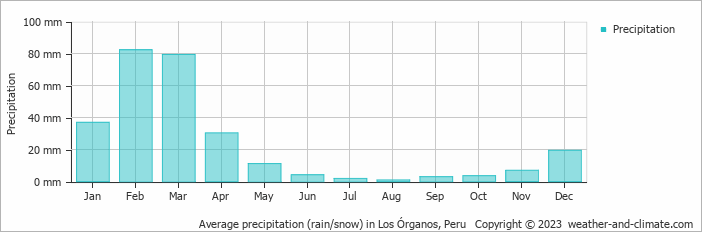
  • Los Órganos has dry periods in May, June, July, August, September, October, November and December.
  • On average, February is the wettest month with 82 mm of precipitation.
  • On average, August is the driest month with 1 mm of precipitation.
  • The average amount of annual precipitation is 279 mm.

Weather Forecasts for Los Órganos

Fri   Apr 19
32°C | 24°C
W 14 km/h
broken clouds and no rain

broken clouds and no rain

Sat   Apr 20
35°C | 23°C
SW 22 km/h
2.7 mm
broken clouds and  chance of slight rain

broken clouds and chance of slight rain

Sun   Apr 21
31°C | 22°C
W 14 km/h
broken clouds and no rain

broken clouds and no rain

Interested in more climate information?

Weather and Climate provides you with all the information you need about the climate in Los Órganos.

Our site offers climate and forecast data for every country in the world. Are you going to Peru? On this website you can find historical weather averages for many cities in Peru. Not sure yet where to go? We now have a tool which recommends destinations that suit your ideal climate conditions. Find out where to go with our weather planner.