ClimateForecastAprilMay >>

Average monthly snow and rainfall in Las Grutas

The mean monthly precipitation over the year in Las Grutas (Río Negro), including rain, snow, hail.

Average monthly rainfall, snow, precipitation in Las Grutas,

Feel free to add this climate graph to your website. Click the copy button above.

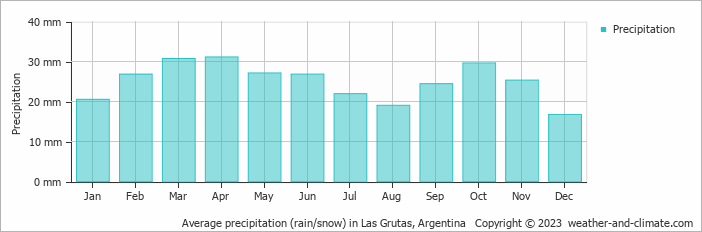
  • Las Grutas has dry periods in January, July, August, September and December.
  • On average, April is the wettest month with 31 mm of precipitation.
  • On average, December is the driest month with 17 mm of precipitation.
  • The average amount of annual precipitation is 300 mm.

Weather Forecasts for Las Grutas

Fri   Apr 19
23°C | 11°C
NW 25 km/h
partly cloudy and no rain

partly cloudy and no rain

Sat   Apr 20
17°C | 7°C
E 14 km/h
partly cloudy and no rain

partly cloudy and no rain

Sun   Apr 21
14°C | 7°C
SE 25 km/h
partly cloudy and no rain

partly cloudy and no rain

Interested in more climate information?

Weather and Climate provides you with all the information you need about the climate in Las Grutas.

Our site offers climate and forecast data for every country in the world. Are you going to Argentina? On this website you can find historical weather averages for many cities in Argentina. Not sure yet where to go? We now have a tool which recommends destinations that suit your ideal climate conditions. Find out where to go with our weather planner.