ClimateForecastAprilMay >>

Average monthly snow and rainfall in La Plata

The mean monthly precipitation over the year in La Plata (Buenos Aires Province), including rain, snow, hail.

Average monthly rainfall, snow, precipitation in La Plata,

Feel free to add this climate graph to your website. Click the copy button above.

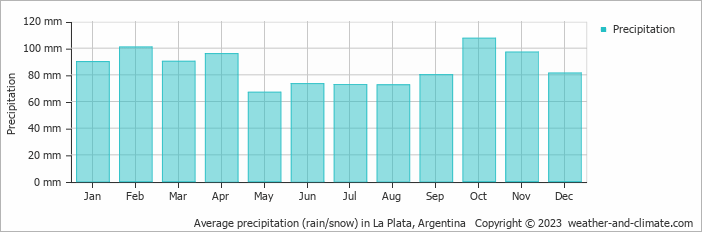
  • Most rainfall (rainy season) is seen in February and October.
  • On average, October is the wettest month with 107 mm of precipitation.
  • On average, May is the driest month with 67 mm of precipitation.
  • The average amount of annual precipitation is 1027 mm.

Weather Forecasts for La Plata

Fri   Apr 19
24°C | 15°C
NW 18 km/h
partly cloudy and no rain

partly cloudy and no rain

Sat   Apr 20
23°C | 16°C
NW 14 km/h
partly cloudy and no rain

partly cloudy and no rain

Sun   Apr 21
22°C | 14°C
SE 18 km/h
overcast and no rain

overcast and no rain

Interested in more climate information?

Weather and Climate provides you with all the information you need about the climate in La Plata.

Our site offers climate and forecast data for every country in the world. Are you going to Argentina? On this website you can find historical weather averages for many cities in Argentina. Not sure yet where to go? We now have a tool which recommends destinations that suit your ideal climate conditions. Find out where to go with our weather planner.