Average monthly snow and rainfall in Kumara
The mean monthly precipitation over the year in Kumara (West Coast), including rain, snow, hail.
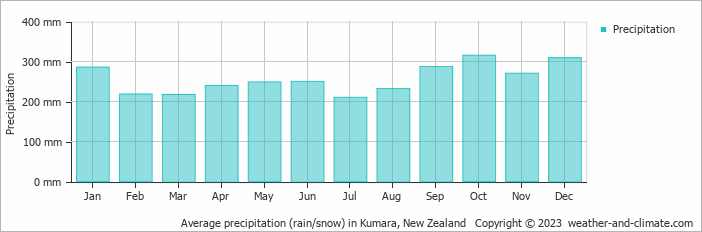
- A lot of rain (rainy season) falls in the months: January, February, March, April, May, June, July, August, September, October, November and December.
- On average, October is the wettest month with 315 mm of precipitation.
- On average, July is the driest month with 210 mm of precipitation.
- The average amount of annual precipitation is 3082 mm.
Weather Forecasts for Kumara
Fri Apr 19
16°C | 7°C
W  7 km/h
7 km/h1.2 mm
overcast and chance of rain
Sat Apr 20
17°C | 6°C
SW 11 km/h
11 km/halmost clear and no rain
Sun Apr 21
16°C | 7°C
W 11 km/h
11 km/h0.6 mm
broken clouds and chance of slight rain