Average monthly snow and rainfall in Kew
The mean monthly precipitation over the year in Kew (), including rain, snow, hail.
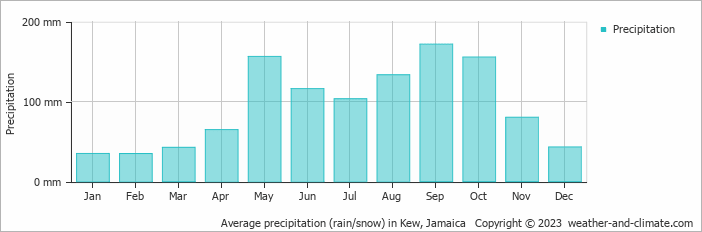
- A lot of rain (rainy season) falls in the months: May, June, July, August, September and October.
- On average, September is the wettest month with 172 mm of precipitation.
- On average, February is the driest month with 35 mm of precipitation.
- The average amount of annual precipitation is 1135 mm.
Weather Forecasts for Kew
Wed Apr 24
34°C | 25°C
NE  29 km/h
29 km/halmost clear and no rain
Thu Apr 25
34°C | 24°C
NE 29 km/h
29 km/h0.3 mm
partly cloudy and small chance of slight rain
Fri Apr 26
34°C | 24°C
NE 29 km/h
29 km/h4.4 mm
partly cloudy and thunder


