ClimateForecastAprilMay >>

Average monthly snow and rainfall in Harboør

The mean monthly precipitation over the year in Harboør (Midtjylland), including rain, snow, hail.

Average monthly rainfall, snow, precipitation in Harboør,

Feel free to add this climate graph to your website. Click the copy button above.

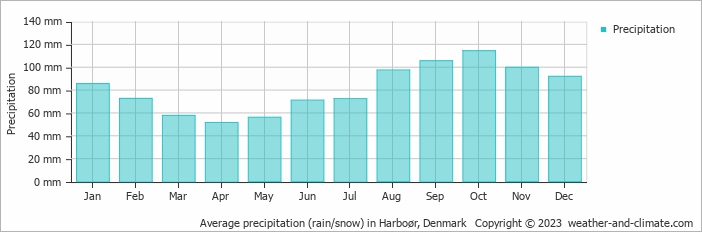
  • Most rainfall (rainy season) is seen in September and October.
  • On average, October is the wettest month with 114 mm of precipitation.
  • On average, April is the driest month with 52 mm of precipitation.
  • The average amount of annual precipitation is 976 mm.

Weather Forecasts for Harboør

Sat   Apr 20
7°C | 3°C
NW 36 km/h
0.4 mm
broken clouds and  chance of slight rain

broken clouds and chance of slight rain

Sun   Apr 21
9°C | 4°C
N 25 km/h
almost clear and no rain

almost clear and no rain

Mon   Apr 22
8°C | 4°C
NW 14 km/h
almost clear and no rain

almost clear and no rain

Interested in more climate information?

Weather and Climate provides you with all the information you need about the climate in Harboør.

Our site offers climate and forecast data for every country in the world. Are you going to Denmark? On this website you can find historical weather averages for many cities in Denmark. Not sure yet where to go? We now have a tool which recommends destinations that suit your ideal climate conditions. Find out where to go with our weather planner.