Average monthly snow and rainfall in Great Yarmouth
The mean monthly precipitation over the year in Great Yarmouth (Norfolk), including rain, snow, hail.
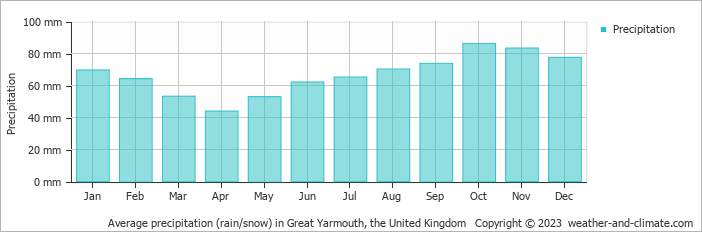
- On average, October is the wettest month with 86 mm of precipitation.
- On average, April is the driest month with 44 mm of precipitation.
- The average amount of annual precipitation is 802 mm.
Weather Forecasts for Great Yarmouth
Thu Apr 25
10°C | 1°C
SW  22 km/h
22 km/h0.8 mm
overcast and slight rain
Fri Apr 26
10°C | 2°C
W 11 km/h
11 km/h0.9 mm
broken clouds and chance of rain
Sat Apr 27
13°C | 5°C
NE 22 km/h
22 km/h4.1 mm
overcast and heavy rain