ClimateForecastAprilMay >>

Average monthly snow and rainfall in Gracias

The mean monthly precipitation over the year in Gracias (), including rain, snow, hail.

Average monthly rainfall, snow, precipitation in Gracias,

Feel free to add this climate graph to your website. Click the copy button above.

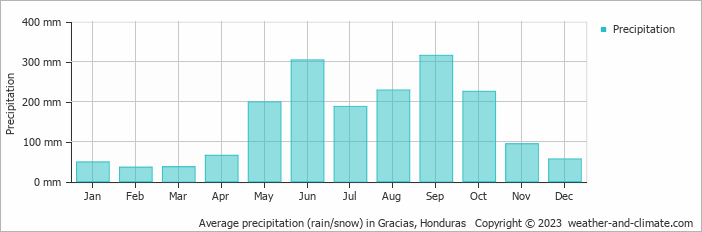
  • A lot of rain (rainy season) falls in the months: May, June, July, August, September and October.
  • On average, September is the wettest month with 315 mm of precipitation.
  • On average, February is the driest month with 36 mm of precipitation.
  • The average amount of annual precipitation is 1793 mm.

Weather Forecasts for Gracias

Tue   Apr 16
35°C | 20°C
N 11 km/h
almost clear and no rain

almost clear and no rain

Wed   Apr 17
35°C | 21°C
N 11 km/h
almost clear and no rain

almost clear and no rain

Thu   Apr 18
35°C | 22°C
N 11 km/h
0.8 mm
partly cloudy and slight rain

partly cloudy and slight rain

Interested in more climate information?

Weather and Climate provides you with all the information you need about the climate in Gracias.

Our site offers climate and forecast data for every country in the world. Are you going to Honduras? On this website you can find historical weather averages for many cities in Honduras. Not sure yet where to go? We now have a tool which recommends destinations that suit your ideal climate conditions. Find out where to go with our weather planner.