Average monthly snow and rainfall in Gerik
The mean monthly precipitation over the year in Gerik (), including rain, snow, hail.
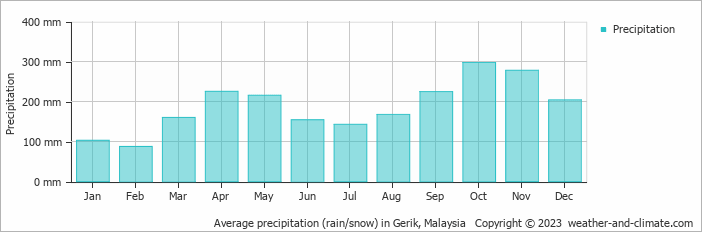
- A lot of rain (rainy season) falls in the months: January, March, April, May, June, July, August, September, October, November and December.
- On average, October is the wettest month with 297 mm of precipitation.
- On average, February is the driest month with 87 mm of precipitation.
- The average amount of annual precipitation is 2256 mm.
Weather Forecasts for Gerik
Sat Apr 20
35°C | 24°C
W  11 km/h
11 km/h4.4 mm
broken clouds and thunder
Sun Apr 21
36°C | 23°C
N 11 km/h
11 km/h8.8 mm
broken clouds and thunder
Mon Apr 22
37°C | 23°C
NW 11 km/h
11 km/hpartly cloudy and no rain