Average monthly snow and rainfall in Garapan
The mean monthly precipitation over the year in Garapan (Saipan), including rain, snow, hail.
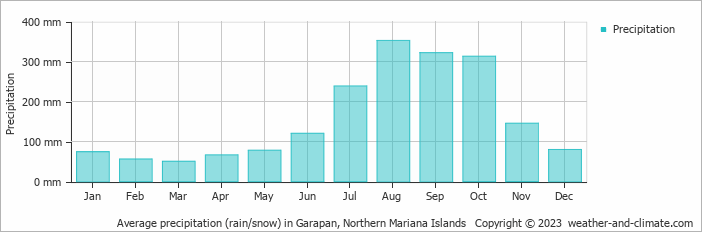
- A lot of rain (rainy season) falls in the months: June, July, August, September, October and November.
- On average, August is the wettest month with 352 mm of precipitation.
- On average, March is the driest month with 50 mm of precipitation.
- The average amount of annual precipitation is 1894 mm.
Weather Forecasts for Garapan
Fri Apr 26
31°C | 27°C
E  32 km/h
32 km/h0.4 mm
partly cloudy and small chance of slight rain
Sat Apr 27
31°C | 27°C
E 32 km/h
32 km/h0.7 mm
partly cloudy and small chance of slight rain
Sun Apr 28
31°C | 27°C
E 25 km/h
25 km/h2.5 mm
partly cloudy and chance of rain


