Average monthly snow and rainfall in Den Burg
The mean monthly precipitation over the year in Den Burg (Noord-Holland), including rain, snow, hail.
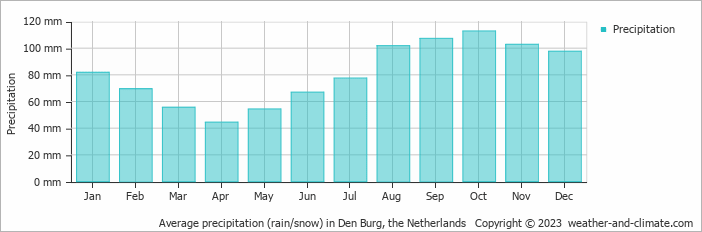
- A lot of rain (rainy season) falls in the months: August, September, October and November.
- On average, October is the wettest month with 113 mm of precipitation.
- On average, April is the driest month with 44 mm of precipitation.
- The average amount of annual precipitation is 972 mm.
Weather Forecasts for Den Burg
Wed Apr 24
9°C | 5°C
NW  40 km/h
40 km/h3.6 mm
partly cloudy and rain
Thu Apr 25
8°C | 4°C
SW 36 km/h
36 km/h6.1 mm
overcast and heavy rain
Fri Apr 26
9°C | 5°C
N 14 km/h
14 km/hbroken clouds and no rain


