Average monthly snow and rainfall in Dayr al Qamar
The mean monthly precipitation over the year in Dayr al Qamar (Mount Lebanon), including rain, snow, hail.
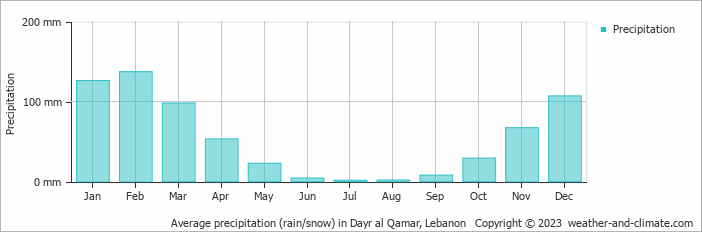
- A lot of rain (rainy season) falls in the months: January, February and December.
- Dayr al Qamar has dry periods in May, June, July, August and September.
- On average, February is the wettest month with 137 mm of precipitation.
- On average, July is the driest month with 1 mm of precipitation.
- The average amount of annual precipitation is 654 mm.
Weather Forecasts for Dayr al Qamar
Thu Apr 18
24°C | 13°C
SW  18 km/h
18 km/halmost clear and no rain
Fri Apr 19
21°C | 11°C
W 11 km/h
11 km/hpartly cloudy and no rain
Sat Apr 20
23°C | 11°C
NW 7 km/h
7 km/hpartly cloudy and no rain


