Average monthly snow and rainfall in Culebra in inches

This is the mean monthly precipitation over the year, including rain, snow, hail etc.
Show average precipitation in Culebra in Millimeter »

Average precipitation (rain/snow) in Culebra, Puerto Rico   Copyright © 2023  weather-and-climate.com

Feel free to add this climate graph to your website. Click the copy button above.


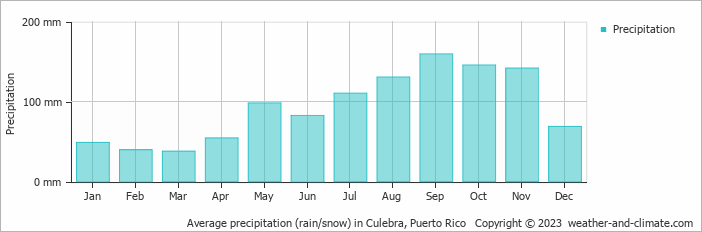
  • A lot of rain (rainy season) falls in the months: January, February, April, May, June, July, August, September, October, November and December.
  • On average, September is the wettest month with 9.9 inches (252 mm) of precipitation.
  • On average, March is the driest month with 3.2 inches (82 mm) of precipitation.
  • The average amount of annual precipitation is: 94.1 inches (2390 mm)


Weather Forecasts for Culebra

Tue   Mar 21
84°F | 77°F
E 20 mph
0.05 inches
half cloudy and slight rain

half cloudy and slight rain

Wed   Mar 22
84°F | 75°F
E 22 mph
0.08 inches
half cloudy and showers

half cloudy and showers

Thu   Mar 23
82°F | 73°F
NE 18 mph
almost clear and no rain

almost clear and no rain

Where to stay in Culebra

Interested in more climate information?

Weather and Climate provides you with all the information you need about the climate in Culebra.

Our site offers climate and forecast data for almost all countries in the world. Are you going to Puerto Rico? On this website you can find historical weather averages for many cities in Puerto Rico. Not sure yet where to go? We now have a tool which suggests which destination suits your ideal climate conditions. Find out where to go with our weather planner.