Average monthly snow and rainfall in Chincha Alta
The mean monthly precipitation over the year in Chincha Alta (Ica), including rain, snow, hail.
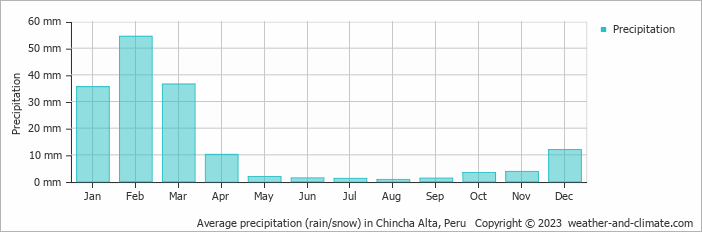
- Chincha Alta has dry periods in April, May, June, July, August, September, October, November and December.
- On average, February is the wettest month with 54 mm of precipitation.
- On average, August is the driest month with 1 mm of precipitation.
- The average amount of annual precipitation is 162 mm.
Weather Forecasts for Chincha Alta
Thu Apr 25
26°C | 18°C
W  18 km/h
18 km/hbroken clouds and no rain
Fri Apr 26
26°C | 18°C
W 18 km/h
18 km/halmost clear and no rain
Sat Apr 27
25°C | 18°C
W 14 km/h
14 km/hclear and no rain


